Ontario Alignment By Overall Expectation
Finding the Equation of a Line Given Slope and a Point
This 3 Act Math Task is a sequel to the Stacking Paper Real World Math Problem I created a couple weeks back. In the previous task, students were asked “How many stacks of paper will it take to reach the ceiling?” That problem had a sequel that explored the scenario of stacking the paper on a table instead of on the floor in order to see if students understood the concept of the initial value/y-intercept.
In this sequel, we will revisit the idea of stacking paper on the table, but take a slightly different approach in order to give students an opportunity to link Finding Equations of a Line Given Slope and a Point to a real world situation.
Please note that this is part two of three tasks in a series:
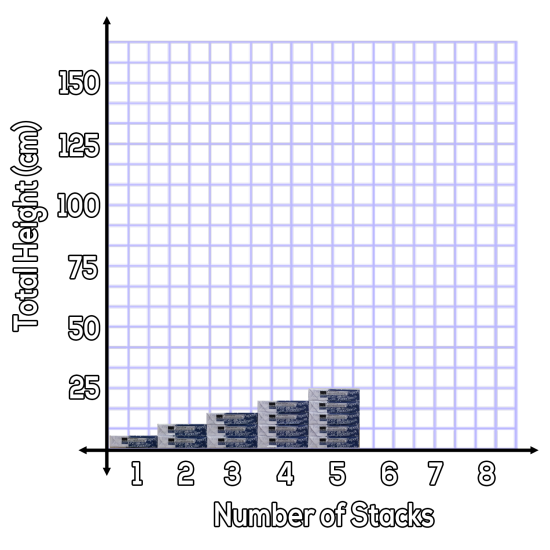
- Stacking Paper – Direct Variation (y-intercept equal to 0)
- Stacking Paper Sequel – Partial Variation (y-intercept not equal to 0)
- Thick Stacks – Finding the Equation of a Line Given Two Points
Act 1: Introducing The Problem
Stacking Paper on a Table
In the first act, students will view the image of the same 5 packages of paper as the original Stacking Paper 3 Act Math Task, but this time on a table instead of on the floor:
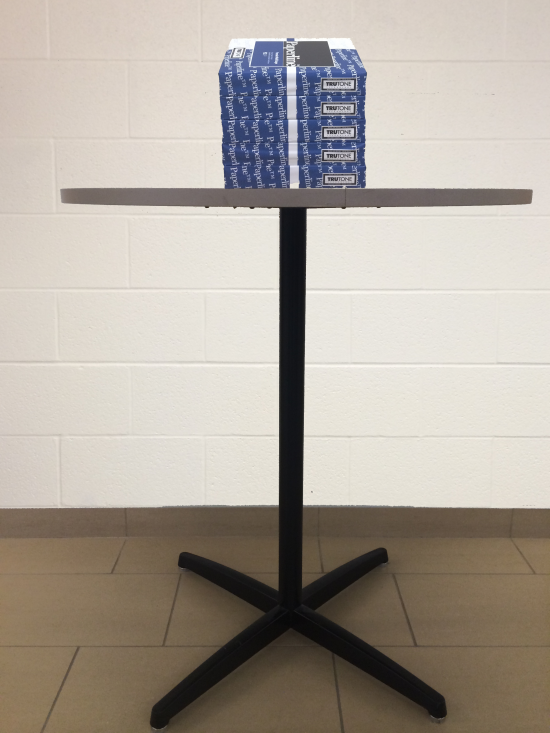
Students are given some time to chat with an elbow partner to decide what question they believe will be asked in this problem. You can try to lead the discussion towards a specific question, or work with what they come up with.
I might suggest that you don’t introduce the question just yet. Move on to Act 2.
Act 2: Reveal Some Information
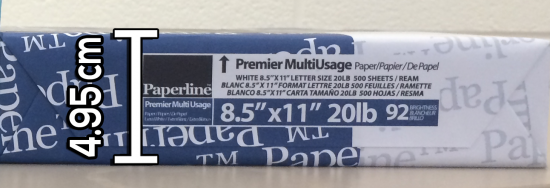
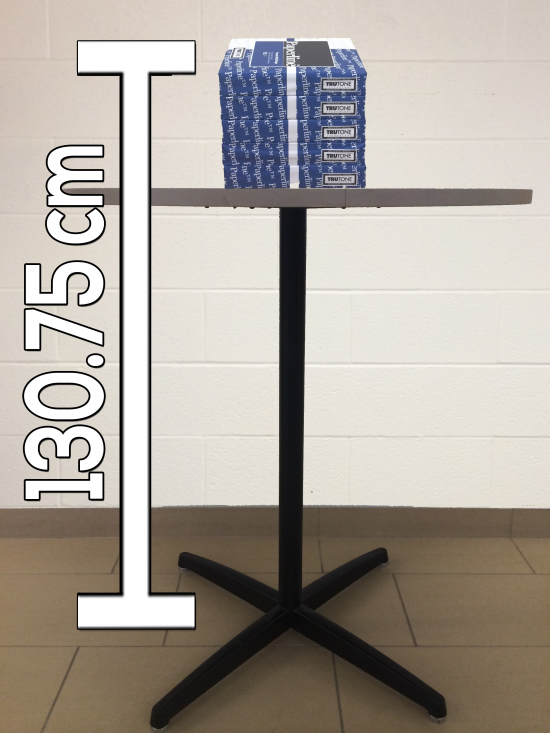
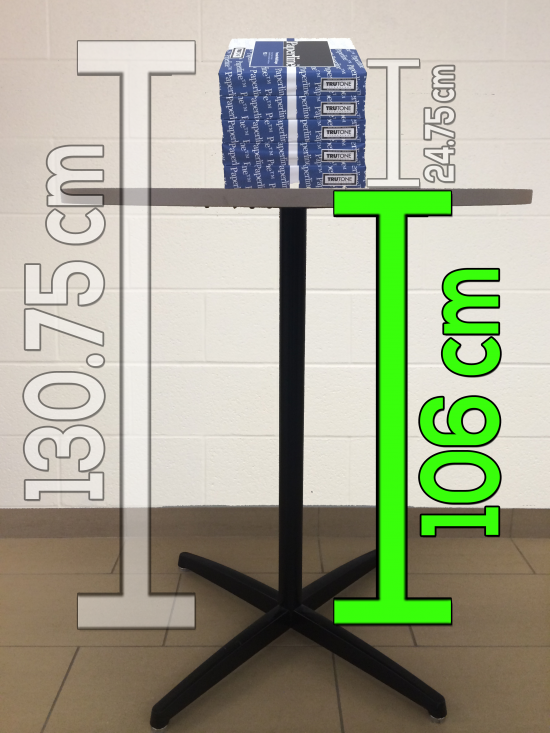
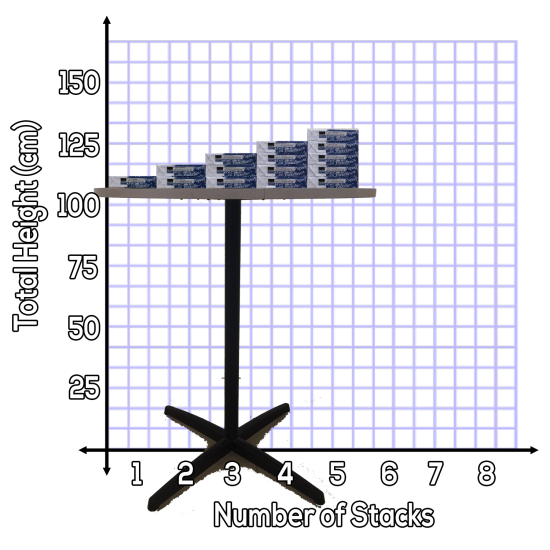
Height of a Single Stack and Total Height of 5 Stacks on a Table
Reveal the following for your students to ponder over…
In this case, since my intention is to introduce the algebraic approach to finding the equation of a line given slope and a point, the ideal question is:
What is the height of the table?
Estimating Using the High/Low/Best Guess Strategy
As Dan Meyer does with most of his 3 Act Math Tasks, having students make some guesses as to values that would be too low and too high for the height of the table to set a range, then have them narrow in on their best guess is a great way to get kids checking whether their final solution is reasonable in comparison to their estimates. The MYCI Team from Malden Public School had used this approach as a specific change in teaching practice throughout one of our professional learning cycles and felt that it helped students determine whether their solutions were reasonable.
Stacking Paper Sequel Inquiry / Discovery
When I introduce this problem, students have all the tools necessary to solve this problem in a number of ways. The prior knowledge my students had before using this question today was:
- an understanding of linear relations,
- an understanding of slope as a rate of change,
- an understanding of the initial value / y-intercept of a line, and
- an understanding of how to use their knowledge via logic, table of values and a graph to solve problems.
With these tools of prior knowledge in their toolbox, I am confident that all of my students could determine the height of the table using one or more of the following strategies:
- Logic – connecting their contextual understanding by determining the height of 5 stacks and subtracting from the total height of the table and 5 stacks of paper,
- Table of Values – making the connection that the height of 5 stacks of paper on the table is 130.75 cm, which can be represented as an (x,y) coordinate in a table of values to work backwards to go from 5 stacks and removing stacks until there are none on the table,
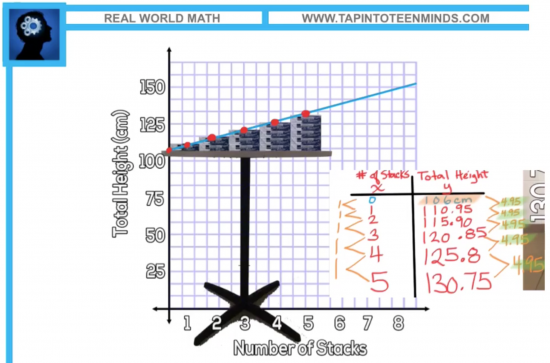
- Graph – making the same connection as the previous to create a graph of this partial variation and extrapolate back to the y-axis to find the y-intercept/initial value.
Here are some screenshots showing these methods:
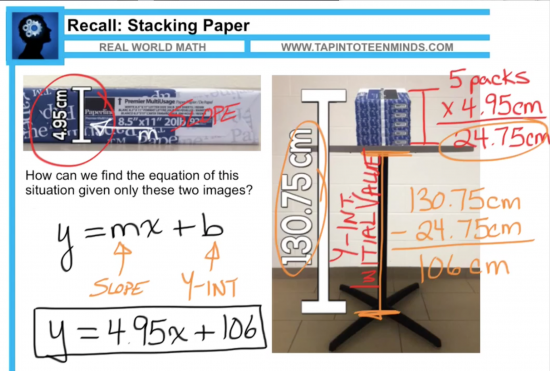
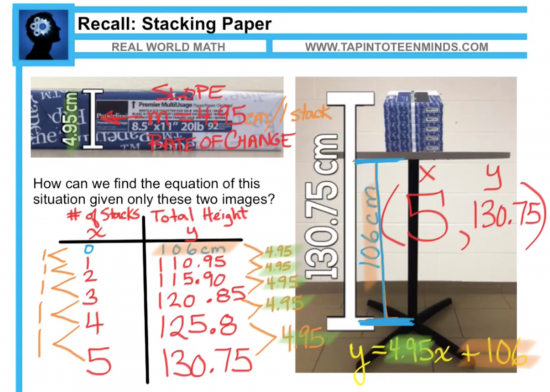
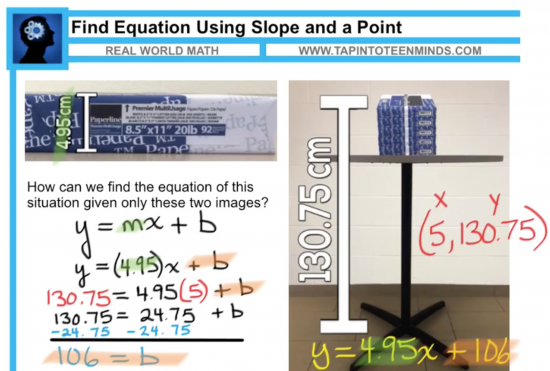
We should also keep in mind that the intention here is to make the connection that the table height is also the initial value making this linear relation a partial variation and thus, is the value of the y-intercept, b in the linear equation, y = mx + b. By allowing students to discover this using their prior knowledge, they will have scaffolded themselves to a point where the algebraic representation of substituting in the slope (height of one stack) for m, 5 stacks for x and the total height of the 5 stacks and the table of 130.75 cm for y, students can then use their prior knowledge of solving simple linear equations to isolate the initial value/y-intercept, b.
Here is a screenshot of what this problem looks like algebraically:
Act 3: Reveal the Solution
The Height of the Table Is…
Students should now be able to create the equation to represent linear relation of Total Height vs. Number of Paper Stacks:
y = 4.95x + 106
Where the initial value of 106 cm represents the height of the table and the slope of 4.95 represents the height of each stack of paper. Therefore, the total height increases by 4.95 cm for each stack of paper added.
It can also be beneficial to give students a visual, especially for those who may not have completely made the connection between the height of the table and the initial value/y-intercept of the linear relation. Justin Levack suggested that I create a graph with a visual underneath:
Interested in taking the discussion further? What happens to the relationship when you remove the table and stack the paper on the floor? How does the equation change? What is the slope? y-intercept?
What This Problem Looks Like In a Textbook
For years, I have introduced the algebraic method for finding the equation of a line given slope and a point with little to no context. Why? Because that’s what is in the textbook! Check out the first example I usually introduce:
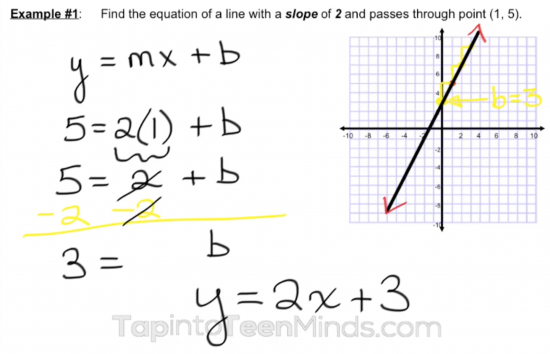
How nice of me, eh?
The traditional “easy” introduction to a concept that is usually considered difficult by the students. With every topic I find ways to add context to, I realize that the math isn’t the hard part; the lack of meaning in so much of the math we introduce is the killer. How can we expect kids to ever feel like they know what they are doing unless they can memorize procedure. And you know how I feel about teaching math based on procedures alone!
By spending the time necessary for students to make connections, all of my students gave me the “thumbs up” on understanding as we ended the class today. A topic I typically spend two full days on using questions like you see in the image above is now only one day and I can move on to the next traditionally “tough” topic of doing the same thing using two points instead of slope and a point. I anticipate that I will be able to shave off the second day I usually use on that topic as well. Understanding and efficiency; BONUS!
Inquiry/Discovery, Introduce Algebraic Strategy and Consolidate Learning
Here is a video that gives an overview of some of the solutions my students came up with today, the connections we made after sharing out the different strategies, a consolidation of our new learning and finally a sample problem similar to what you will likely see in a textbook where there is no context.
Stacking Paper Tasks Multi-Touch Book
Grab the multi-touch book for iBooks that has this task as well as other related tasks for an interactive experience.
Learn more about what’s inside the multi-touch book for iBooks here.
Or, consider using the interactive series of Google Sites resources.
As always – please let me know how it goes in your class. Any improvements/modifications you made would be appreciated in the comments so we can all learn and improve.
New to Using 3 Act Math Tasks?
Download the 2-page printable 3 Act Math Tip Sheet to ensure that you have the best start to your journey using 3 Act math Tasks to spark curiosity and fuel sense making in your math classroom!
Share With Your Learning Community:

About Kyle Pearce
I’m Kyle Pearce and I am a former high school math teacher. I’m now the K-12 Mathematics Consultant with the Greater Essex County District School Board, where I uncover creative ways to spark curiosity and fuel sense making in mathematics. Read more.
Access Other Real World Math Tasks
Search More 3 Act Math Tasks
Grade 2 [2.B1.1, 2.B1.3, 2.B2.1, 2.B2.2, 2.B2.3, 2.B2.4, Measurement - M1, Number Sense and Numeration - NS1, Number Sense and Numeration - NS2, Number Sense and Numeration - NS3]
Grade 3 [3.B1.5, 3.B2.1, 3.B2.3, 3.B2.7, Measurement - M1, Number Sense and Numeration - NS1, Number Sense and Numeration - NS3]
Grade 4 [4.B2.1, 4.B2.4, 4.E2.5, 4.E2.6, Measurement - M1, Number Sense and Numeration - NS1, Number Sense and Numeration - NS3, Patterning and Algebra - PA2]
Grade 5 [5.B1.7, 5.B2.9, 5.D1.3, 5.D1.6, 5.E2.6, 5.F1.2, 5.F1.5, Measurement - M1, Measurement - M2, Number Sense and Numeration - NS1, Number Sense and Numeration - NS3, Patterning and Algebra - PA2]
Grade 6 [6.B2.12, 6.B2.9, Data Management and Probability - DP3, Measurement - M1, Measurement - M2, Number Sense and Numeration - NS1, Number Sense and Numeration - NS2, Number Sense and Numeration - NS3, Patterning and Algebra - PA1, Patterning and Algebra - PA2]
Grade 7 [7.B1.3, 7.B1.4, 7.B1.7, 7.B2.2, 7.B2.3, 7.C1.1, 7.C1.2, 7.C1.3, 7.C1.4, 7.D1.6, Data Management and Probability - DP3, Geometry and Spatial Sense - GS1, Measurement - M1, Measurement - M2, Number Sense and Numeration - NS1, Number Sense and Numeration - NS2, Number Sense and Numeration - NS3, Patterning and Algebra - PA1, Patterning and Algebra - PA2]
Grade 8 [8.B1.4, 8.B2.5, 8.C1.1, 8.C1.2, 8.C1.3, 8.C1.4, Data Management and Probability - DP1, Data Management and Probability - DP3, Geometry and Spatial Sense - GS2, Measurement - M1, Measurement - M2, Number Sense and Numeration - NS1, Number Sense and Numeration - NS2, Number Sense and Numeration - NS3, Patterning and Algebra - PA1, Patterning and Algebra - PA2]
Grade 9 [9.B3.5, 9.C3.1, 9.C3.2, 9.C3.3]
Kindergarten [k.15.1, k.15.10, k.15.2]
MAP4C [Mathematical Models - MM1, Mathematical Models - MM2, Mathematical Models - MM3]
MAT1LMAT2LMBF3C [Data Management - DM1, Data Management - DM2, Geometry and Trigonometry - GT1, Geometry and Trigonometry - GT2, Mathematical Models - MM1, Mathematical Models - MM2, Mathematical Models - MM3]
MCF3M [Exponential Functions - EF2, Quadratic Functions - QF1, Quadratic Functions - QF2, Quadratic Functions - QF3, Trigonometric Functions - TF1, Trigonometric Functions - TF3]
MCR3U [Characteristics of Functions - CF1, Characteristics of Functions - CF2, Exponential Functions - EF2, Exponential Functions - EF3, Trigonometric Functions - TF3]
MCT4C [Exponential Functions - EF1, Trigonometric Functions - TF3]
MCV4U [Derivatives and Their Applications - DA2]
MDM4U [Counting and Probability - CP2, Organization of Data For Analysis - DA2, Probability Distributions - PD1, Statistical Analysis - SA1, Statistical Analysis - SA2]
MEL4EMFM1P [Linear Relations - LR1, Linear Relations - LR2, Linear Relations - LR3, Linear Relations - LR4, Measurement and Geometry - MG1, Measurement and Geometry - MG2, Measurement and Geometry - MG3, Number Sense and Algebra - NA1, Number Sense and Algebra - NA2]
MFM2P [Measurement and Trigonometry - MT1, Measurement and Trigonometry - MT2, Measurement and Trigonometry - MT3, Modelling Linear Relations - LR1, Modelling Linear Relations - LR2, Modelling Linear Relations - LR3, Quadratic Relations in y = ax^2 + bx + c Form - QR1, Quadratic Relations in y = ax^2 + bx + c Form - QR2, Quadratic Relations in y = ax^2 + bx + c Form - QR3]
MHF4U [Characteristics of Functions - CF3, Exponential and Logarithmic Functions - EL2, Exponential and Logarithmic Functions - EL3]
MPM1D [AG3, Analytic Geometry - AG1, Analytic Geometry - AG2, LR1, LR2, LR3, MG1, MG2, MG3, NA1, Number Sense and Algebra - NA2]
MPM2D [AG1, AG2, AG3, QR2, Quadratic Relations - QR3, Quadratic Relations - QR4, T2, T3]
Functions [F-BF.1, F-BF.3, F-IF.4, F-LE.1, F-LE.2, F-LE.3, F-TF.5]
Geometry [G-C.5, G-C.8, G-C.9, G-GMD.3, G-GMD.4, G-GPE.4, G-GPE.5, G-GPE.7, G-MG.1, G-MG.2, G-SRT.11]
Grade 1 [1.NBT.4, 1.OA.1, 1.OA.6, 1.OA.A.1, 1.OA.B.3, 1.OA.B.4, 1.OA.C.5, 1.OA.C.6]
Grade 2 [2.NBT.5, 2.NBT.B.5, 2.NBT.B.8, 2.NBT.B.9, 2.OA.2, 2.OA.A.1, 2.OA.B.2]
Grade 3 [3.MD.C.5, 3.NBT.2, 3.NF.1, 3.NF.2, 3.NF.3, 3.NF.A.1, 3.OA.1, 3.OA.5, 3.OA.9]
Grade 4 [4-MD.3, 4.MD.1, 4.MD.2, 4.NBT.6, 4.NF.3, 4.NF.5, 4.NF.6, 4.OA.1, 4.OA.5]
Grade 5 [5.B1.7, 5.D1.3, 5.D1.6, 5.MD.1, 5.MD.3, 5.MD.4, 5.MD.5, 5.NBT.2, 5.NBT.3, 5.NBT.6, 5.NBT.7, 5.NF.1, 5.NF.2, 5.NF.3, 5.NF.4, 5.NF.5, 5.OA.1, 5.OA.2, 5.OA.3]
Grade 6 [6.EE.1, 6.EE.2, 6.EE.5, 6.EE.6, 6.EE.7, 6.G.1, 6.G.2, 6.NS.1, 6.NS.3, 6.NS.6, 6.NS.B.3, 6.NS.C.6, 6.NS.C.7, 6.NS.C.8, 6.RP.1, 6.RP.2, 6.RP.3, 6.RP.A.1, 6.RP.A.2, 6.RP.A.3, 6.RP.A.3.C]
Grade 7 [7.EE.3, 7.EE.4, 7.EE.A.1, 7.G.3, 7.G.4, 7.G.6, 7.NS.A.1, 7.NS.A.2, 7.RP.1, 7.RP.3, 7.RP.A.2.B, 7.RP.A.3, 7.SP.2, 7.SP.5, 7.SP.6]
Grade 8 [8.EE.1, 8.EE.5, 8.EE.6, 8.EE.7, 8.EE.8, 8.F.2, 8.F.3, 8.F.4, 8.F.5, 8.G.5, 8.G.6, 8.G.7, 8.G.9, 8.SP.1]
Grade 9Kindergarten [K.CC.A.1, K.NBT.A.1, K.OA.A.1, K.OA.A.2, K.OA.A.3]
Practice [MP.1, MP.2, MP.3, MP.4, MP.6, MP.7]
Statistics & Probability [S-ID.6, S-MD.4]