No Expectations/Standards Selected
CCSS Alignment By Grade
CCSS Alignment By Standard
Making Predictions With Scatter Plots in the Real World
This Real World 3 Act Math Task will have students making predictions via interpolation and extrapolation using scatter plots and a line of best fit.
Related Math Topics:
Data management of two-variables including:
- making predictions between two-variables,
- creating scatter plots,
- classifying correlations as positive/negative and strong/weak, and
- interpolating and extrapolating using a line of best fit.
This task can be extended to linear relations and equations by having students determine an equation of the line of best fit or alternatively, non-linear regression to find an equation of a curve of best fit.
If you haven’t already, I recommend using the Candle Burning 3 Act Math Task prior to using this task, as the data appears to have a stronger linear correlation.
Act 1: Introducing the Problem
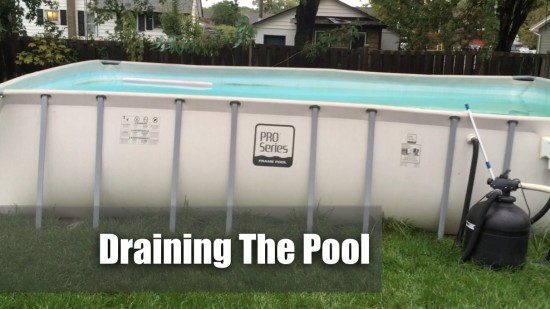
Show students Act 1:
After showing the video clip, I have students discuss with their group some questions that come to mind. Sometimes, I have students focus on two types of questions:
- The first question that comes to mind; and,
- a unique question you don’t think someone will come up with.
This tends to differentiate the question responses rather than seeing a ton of the most obvious one. We discuss these options, then settle on our first question:
How long will it take to empty the pool?
Then, we move on to Act 2.
Act 2: Reveal Some Useful Information
I personally don’t ask too many questions about what information they want, as most tend to know where this problem is heading.
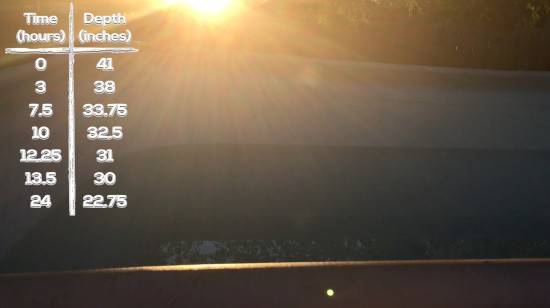
Show them Act 2:
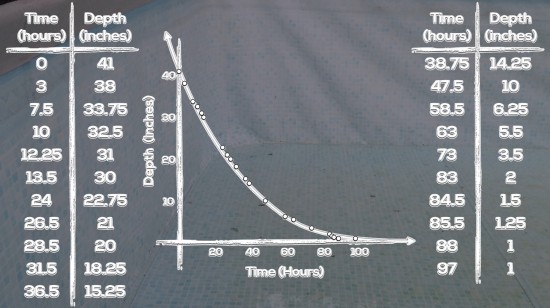
Although I try to avoid fading out my videos to ensure the information doesn’t go away, here’s a screenshot of the last frame, for your use:
Feel free to save the image.
At this point, students can head off on their merry way. I find most of my students tend to go straight for a scatter plot and extend a line of best fit, while others might choose to try to leverage the initial value/y-intercept and estimate a rate of change/slope to create an equation. At midterm and beyond, I’m hoping that the second option becomes more attractive to my students since we have been working with linear equations quite a bit. If no students head in that direction, I would introduce it during the consolidation of the problem as a potential strategy for future use.
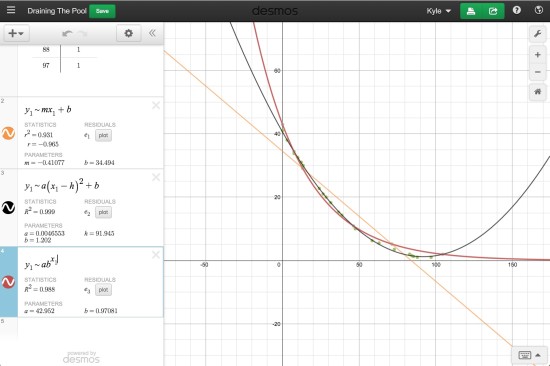
If you’re beyond students drawing scatter plots and want to do something more advanced with this problem, consider using Desmos as a way to manipulate and interpret data.
Click the image below to grab a shared Desmos graph with all the data points plotted from a table of values with regression line/curves:
Act 3: See The Answer!
Once students have updated their prediction based on their mathematical thinking, we can show students Act 3 so they can cheer (or cry) based on what really happened:
Here’s a screenshot of the last frame, if you’d like to use it for some of your consolidation:
Feel free to download the Act 3 image.
Sequels / Extensions
- What do you predict the depth of the pool would be after 17 hours of draining? (interpolation)
- What would be a reasonable drain rate for this pool assuming the trend is linear?
- What would be a reasonable equation for a line (or curve) of best fit?
Please comment to let me know how it worked in your classroom!
New to Using 3 Act Math Tasks?
Download the 2-page printable 3 Act Math Tip Sheet to ensure that you have the best start to your journey using 3 Act math Tasks to spark curiosity and fuel sense making in your math classroom!
Share With Your Learning Community:

About Kyle Pearce
I’m Kyle Pearce and I am a former high school math teacher. I’m now the K-12 Mathematics Consultant with the Greater Essex County District School Board, where I uncover creative ways to spark curiosity and fuel sense making in mathematics. Read more.
Access Other Real World Math Tasks
Search More 3 Act Math Tasks
Grade 2 [2.B1.1, 2.B1.3, 2.B2.1, 2.B2.2, 2.B2.3, 2.B2.4, Measurement - M1, Number Sense and Numeration - NS1, Number Sense and Numeration - NS2, Number Sense and Numeration - NS3]
Grade 3 [3.B1.5, 3.B2.1, 3.B2.3, 3.B2.7, Measurement - M1, Number Sense and Numeration - NS1, Number Sense and Numeration - NS3]
Grade 4 [4.B2.1, 4.B2.4, 4.E2.5, 4.E2.6, Measurement - M1, Number Sense and Numeration - NS1, Number Sense and Numeration - NS3, Patterning and Algebra - PA2]
Grade 5 [5.B1.7, 5.B2.9, 5.D1.3, 5.D1.6, 5.E2.6, 5.F1.2, 5.F1.5, Measurement - M1, Measurement - M2, Number Sense and Numeration - NS1, Number Sense and Numeration - NS3, Patterning and Algebra - PA2]
Grade 6 [6.B2.12, 6.B2.9, Data Management and Probability - DP3, Measurement - M1, Measurement - M2, Number Sense and Numeration - NS1, Number Sense and Numeration - NS2, Number Sense and Numeration - NS3, Patterning and Algebra - PA1, Patterning and Algebra - PA2]
Grade 7 [7.B1.3, 7.B1.4, 7.B1.7, 7.B2.2, 7.B2.3, 7.C1.1, 7.C1.2, 7.C1.3, 7.C1.4, 7.D1.6, Data Management and Probability - DP3, Geometry and Spatial Sense - GS1, Measurement - M1, Measurement - M2, Number Sense and Numeration - NS1, Number Sense and Numeration - NS2, Number Sense and Numeration - NS3, Patterning and Algebra - PA1, Patterning and Algebra - PA2]
Grade 8 [8.B1.4, 8.B2.5, 8.C1.1, 8.C1.2, 8.C1.3, 8.C1.4, Data Management and Probability - DP1, Data Management and Probability - DP3, Geometry and Spatial Sense - GS2, Measurement - M1, Measurement - M2, Number Sense and Numeration - NS1, Number Sense and Numeration - NS2, Number Sense and Numeration - NS3, Patterning and Algebra - PA1, Patterning and Algebra - PA2]
Grade 9 [9.B3.5, 9.C3.1, 9.C3.2, 9.C3.3]
Kindergarten [k.15.1, k.15.10, k.15.2]
MAP4C [Mathematical Models - MM1, Mathematical Models - MM2, Mathematical Models - MM3]
MAT1LMAT2LMBF3C [Data Management - DM1, Data Management - DM2, Geometry and Trigonometry - GT1, Geometry and Trigonometry - GT2, Mathematical Models - MM1, Mathematical Models - MM2, Mathematical Models - MM3]
MCF3M [Exponential Functions - EF2, Quadratic Functions - QF1, Quadratic Functions - QF2, Quadratic Functions - QF3, Trigonometric Functions - TF1, Trigonometric Functions - TF3]
MCR3U [Characteristics of Functions - CF1, Characteristics of Functions - CF2, Exponential Functions - EF2, Exponential Functions - EF3, Trigonometric Functions - TF3]
MCT4C [Exponential Functions - EF1, Trigonometric Functions - TF3]
MCV4U [Derivatives and Their Applications - DA2]
MDM4U [Counting and Probability - CP2, Organization of Data For Analysis - DA2, Probability Distributions - PD1, Statistical Analysis - SA1, Statistical Analysis - SA2]
MEL4EMFM1P [Linear Relations - LR1, Linear Relations - LR2, Linear Relations - LR3, Linear Relations - LR4, Measurement and Geometry - MG1, Measurement and Geometry - MG2, Measurement and Geometry - MG3, Number Sense and Algebra - NA1, Number Sense and Algebra - NA2]
MFM2P [Measurement and Trigonometry - MT1, Measurement and Trigonometry - MT2, Measurement and Trigonometry - MT3, Modelling Linear Relations - LR1, Modelling Linear Relations - LR2, Modelling Linear Relations - LR3, Quadratic Relations in y = ax^2 + bx + c Form - QR1, Quadratic Relations in y = ax^2 + bx + c Form - QR2, Quadratic Relations in y = ax^2 + bx + c Form - QR3]
MHF4U [Characteristics of Functions - CF3, Exponential and Logarithmic Functions - EL2, Exponential and Logarithmic Functions - EL3]
MPM1D [AG3, Analytic Geometry - AG1, Analytic Geometry - AG2, LR1, LR2, LR3, MG1, MG2, MG3, NA1, Number Sense and Algebra - NA2]
MPM2D [AG1, AG2, AG3, QR2, Quadratic Relations - QR3, Quadratic Relations - QR4, T2, T3]
Functions [F-BF.1, F-BF.3, F-IF.4, F-LE.1, F-LE.2, F-LE.3, F-TF.5]
Geometry [G-C.5, G-C.8, G-C.9, G-GMD.3, G-GMD.4, G-GPE.4, G-GPE.5, G-GPE.7, G-MG.1, G-MG.2, G-SRT.11]
Grade 1 [1.NBT.4, 1.OA.1, 1.OA.6, 1.OA.A.1, 1.OA.B.3, 1.OA.B.4, 1.OA.C.5, 1.OA.C.6]
Grade 2 [2.NBT.5, 2.NBT.B.5, 2.NBT.B.8, 2.NBT.B.9, 2.OA.2, 2.OA.A.1, 2.OA.B.2]
Grade 3 [3.MD.C.5, 3.NBT.2, 3.NF.1, 3.NF.2, 3.NF.3, 3.NF.A.1, 3.OA.1, 3.OA.5, 3.OA.9]
Grade 4 [4-MD.3, 4.MD.1, 4.MD.2, 4.NBT.6, 4.NF.3, 4.NF.5, 4.NF.6, 4.OA.1, 4.OA.5]
Grade 5 [5.B1.7, 5.D1.3, 5.D1.6, 5.MD.1, 5.MD.3, 5.MD.4, 5.MD.5, 5.NBT.2, 5.NBT.3, 5.NBT.6, 5.NBT.7, 5.NF.1, 5.NF.2, 5.NF.3, 5.NF.4, 5.NF.5, 5.OA.1, 5.OA.2, 5.OA.3]
Grade 6 [6.EE.1, 6.EE.2, 6.EE.5, 6.EE.6, 6.EE.7, 6.G.1, 6.G.2, 6.NS.1, 6.NS.3, 6.NS.6, 6.NS.B.3, 6.NS.C.6, 6.NS.C.7, 6.NS.C.8, 6.RP.1, 6.RP.2, 6.RP.3, 6.RP.A.1, 6.RP.A.2, 6.RP.A.3, 6.RP.A.3.C]
Grade 7 [7.EE.3, 7.EE.4, 7.EE.A.1, 7.G.3, 7.G.4, 7.G.6, 7.NS.A.1, 7.NS.A.2, 7.RP.1, 7.RP.3, 7.RP.A.2.B, 7.RP.A.3, 7.SP.2, 7.SP.5, 7.SP.6]
Grade 8 [8.EE.1, 8.EE.5, 8.EE.6, 8.EE.7, 8.EE.8, 8.F.2, 8.F.3, 8.F.4, 8.F.5, 8.G.5, 8.G.6, 8.G.7, 8.G.9, 8.SP.1]
Grade 9Kindergarten [K.CC.A.1, K.NBT.A.1, K.OA.A.1, K.OA.A.2, K.OA.A.3]
Practice [MP.1, MP.2, MP.3, MP.4, MP.6, MP.7]
Statistics & Probability [S-ID.6, S-MD.4]

I completed this task consecutively with the Candle Burning one. My students have both my class and another Algebra1 teacher simultaneously. She is continuing with the “scheduled” curriculum where I am reviewing and reteaching the basics and such from the first semester. Therefore, they are currently learning exponential equations in their “other” Algebra 1 class. Completing these two tasks back to back at this time has been valuable to compare and contrast the different functions suitable for each scenario and why they may be different. It also gave them plenty of practice on using the class calculators to solve for linear regressions.