What Do You Notice? What Do You Wonder?
Show students the following video:
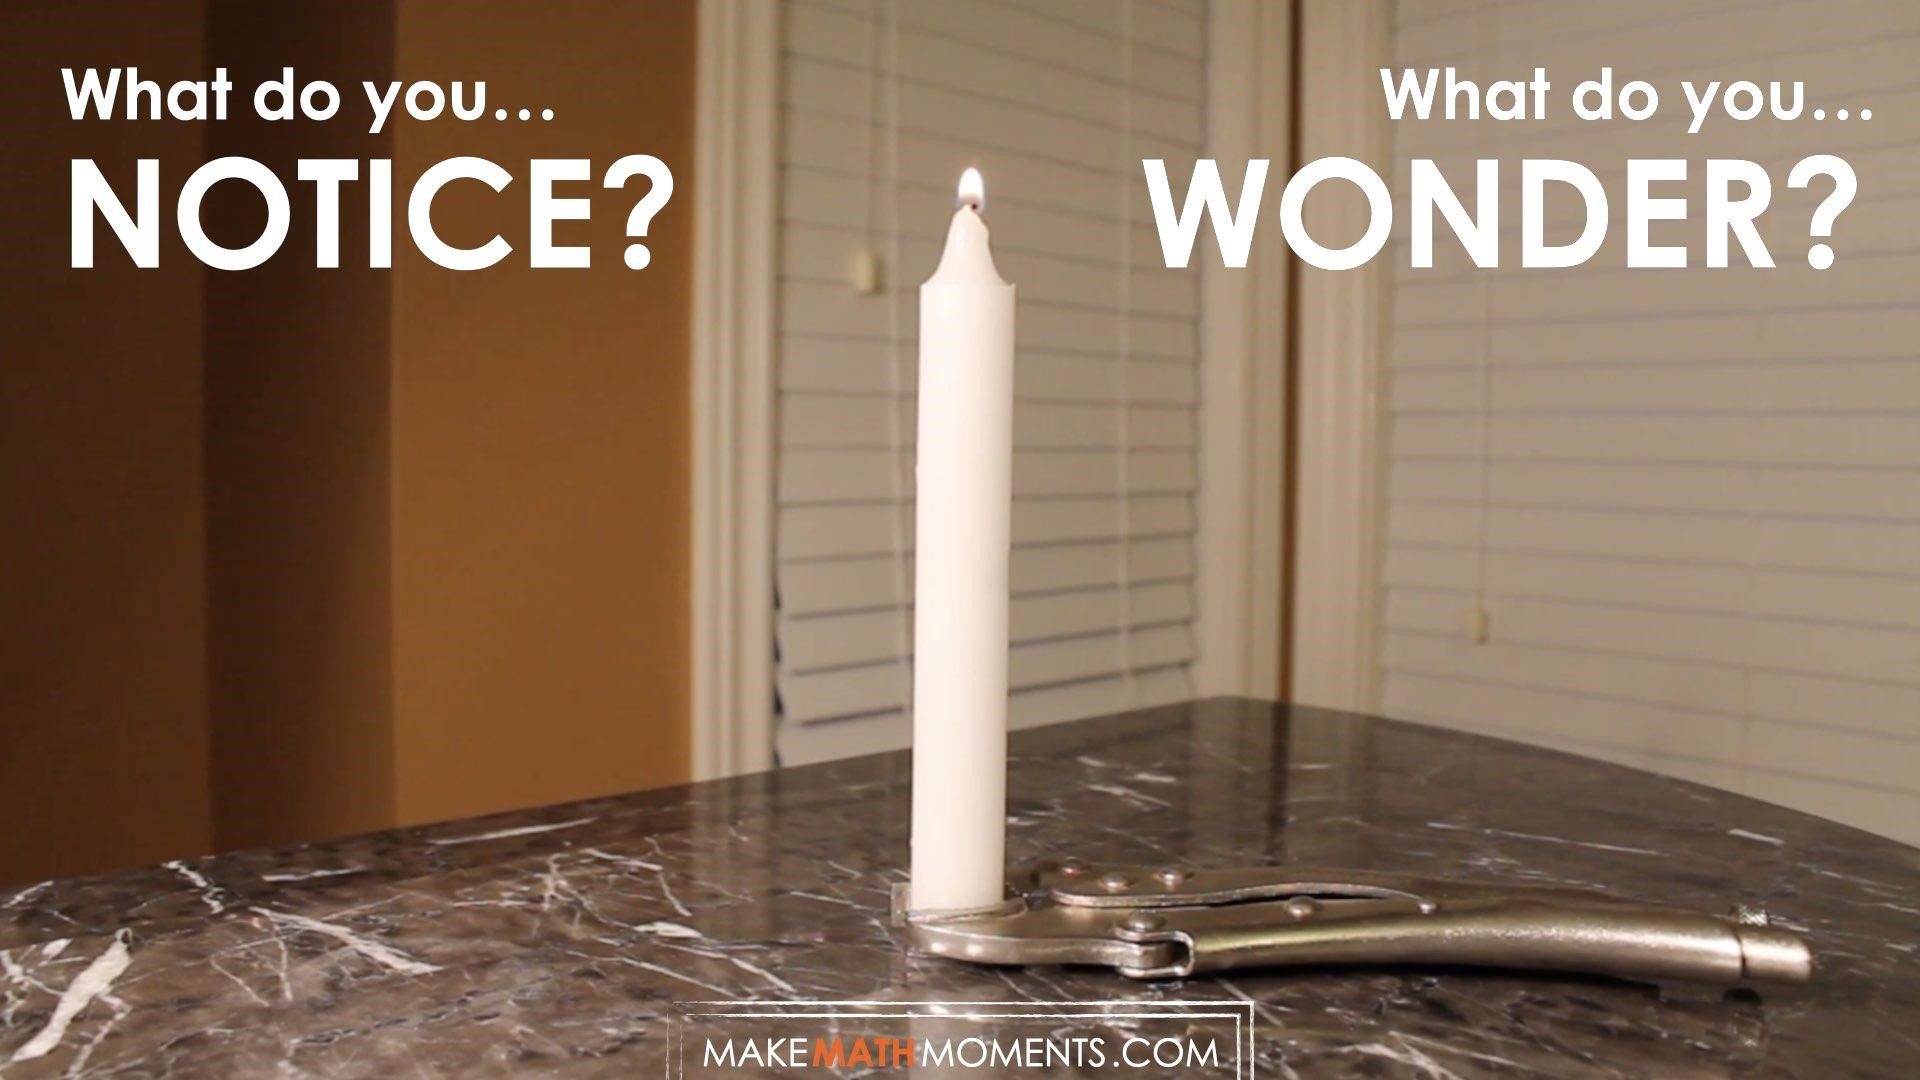
Then, ask students:
What do you notice?
What do you wonder?
Give students 60 seconds (or more) to do a rapid write on a piece of paper.
Replaying the video can be helpful here.
Then, ask students to share with their neighbours for another 60 seconds.
Finally, allow students to share with the entire group. Be sure to write down these noticings and wonderings on the blackboard/whiteboard, chart paper, or some other means to ensure students know that their voice is acknowledged and appreciated.
Some of the noticing and wondering that may come up includes:
- I noticed a candle.
- What is being used to hold the candle?.
- The candle was lit.
- The walls are a copper colour.
- I wonder how long they’ll keep it lit for?
- I wonder how long it will take for the candle to burn out?
- And many more.
At this point, you might comment on some of the things students noticed and potentially answer some of the questions students had, if you can.
Prediction: Estimate
Verbalize the following prompt and share it on the projector for students:
How long will it take before the candle burns out?
Make an estimate.
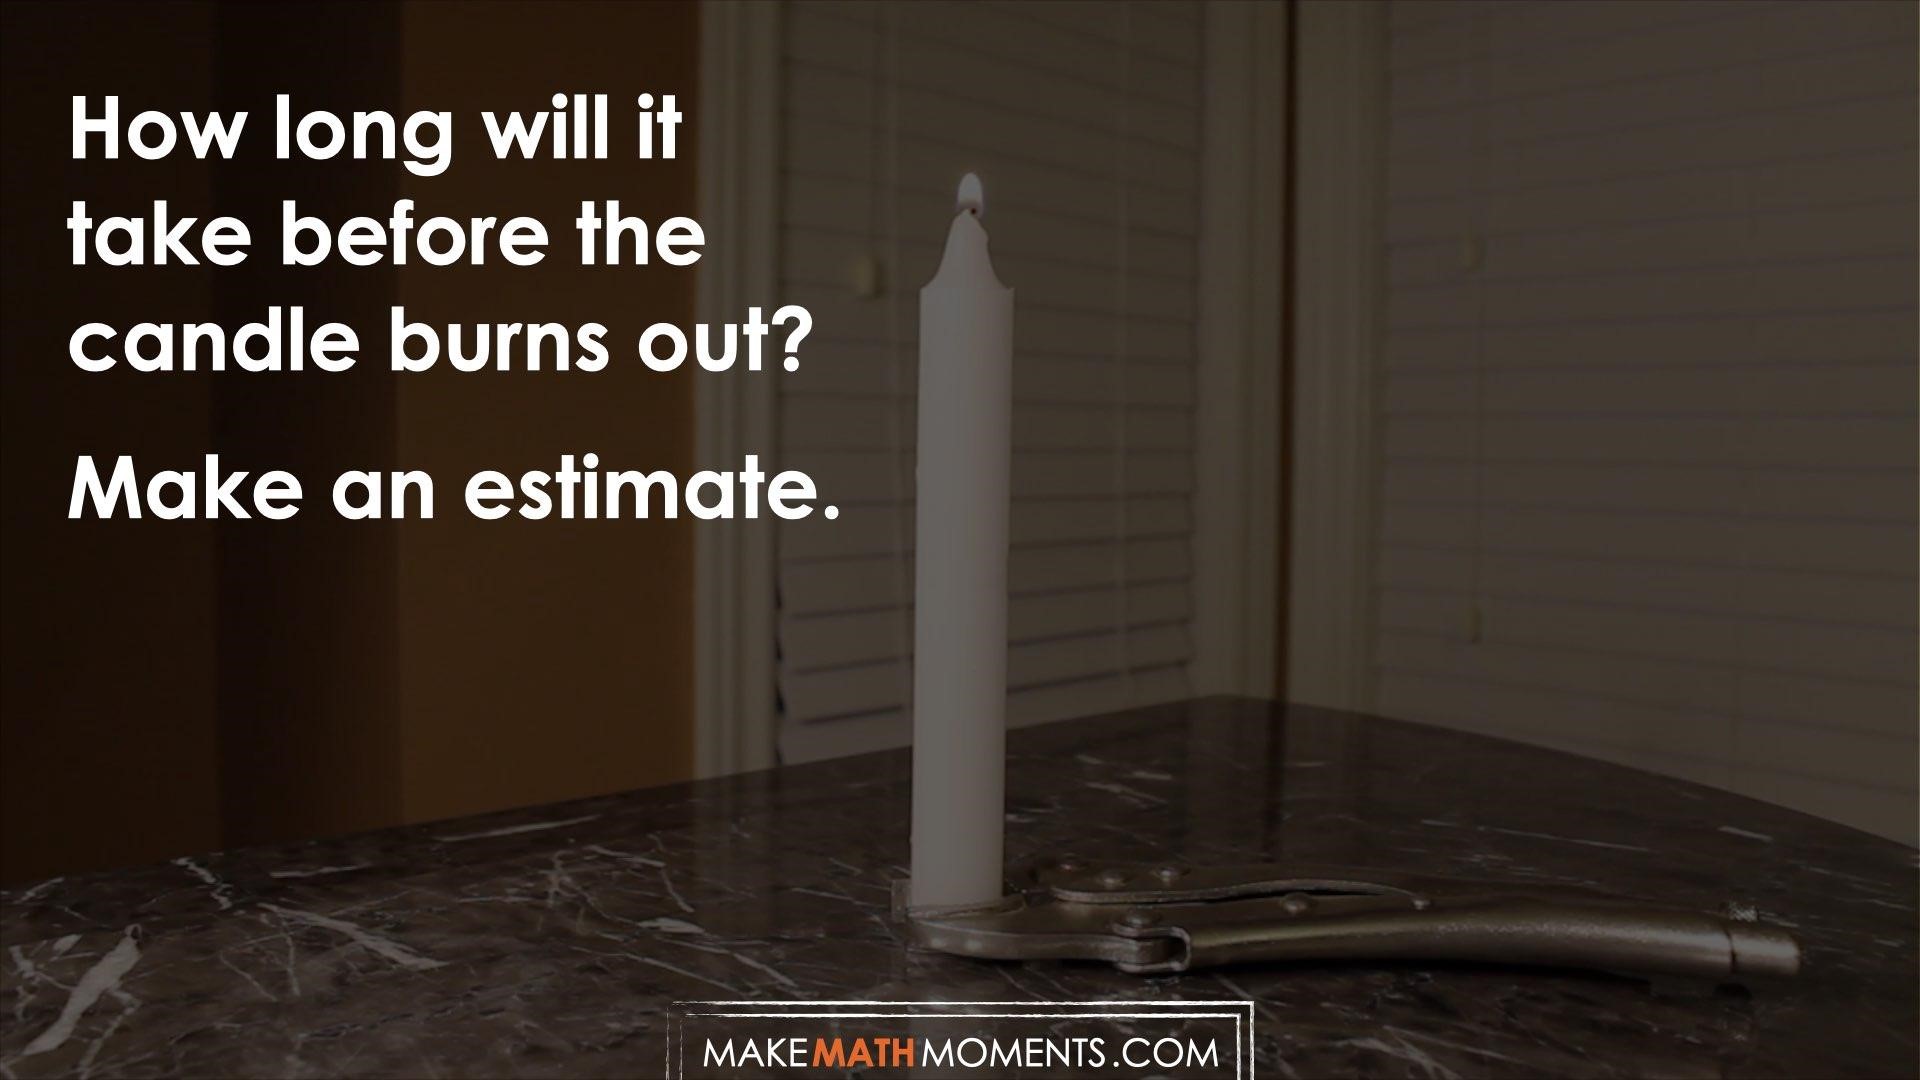
We can now ask students to make a prediction based on their intuition and prior experiences involving candles.
Do your students typically light candles when celebrating a birthday? An important meal? Celebrating a religious holiday? Encourage students to use their prior experiences to make an estimate. Given the lack of information given about this particular candle, you can expect a wide range of estimates to be shared. Highlight how we might be able to use mathematics to help us become more precise with our estimates.
Crafting A Productive Struggle: Prompt
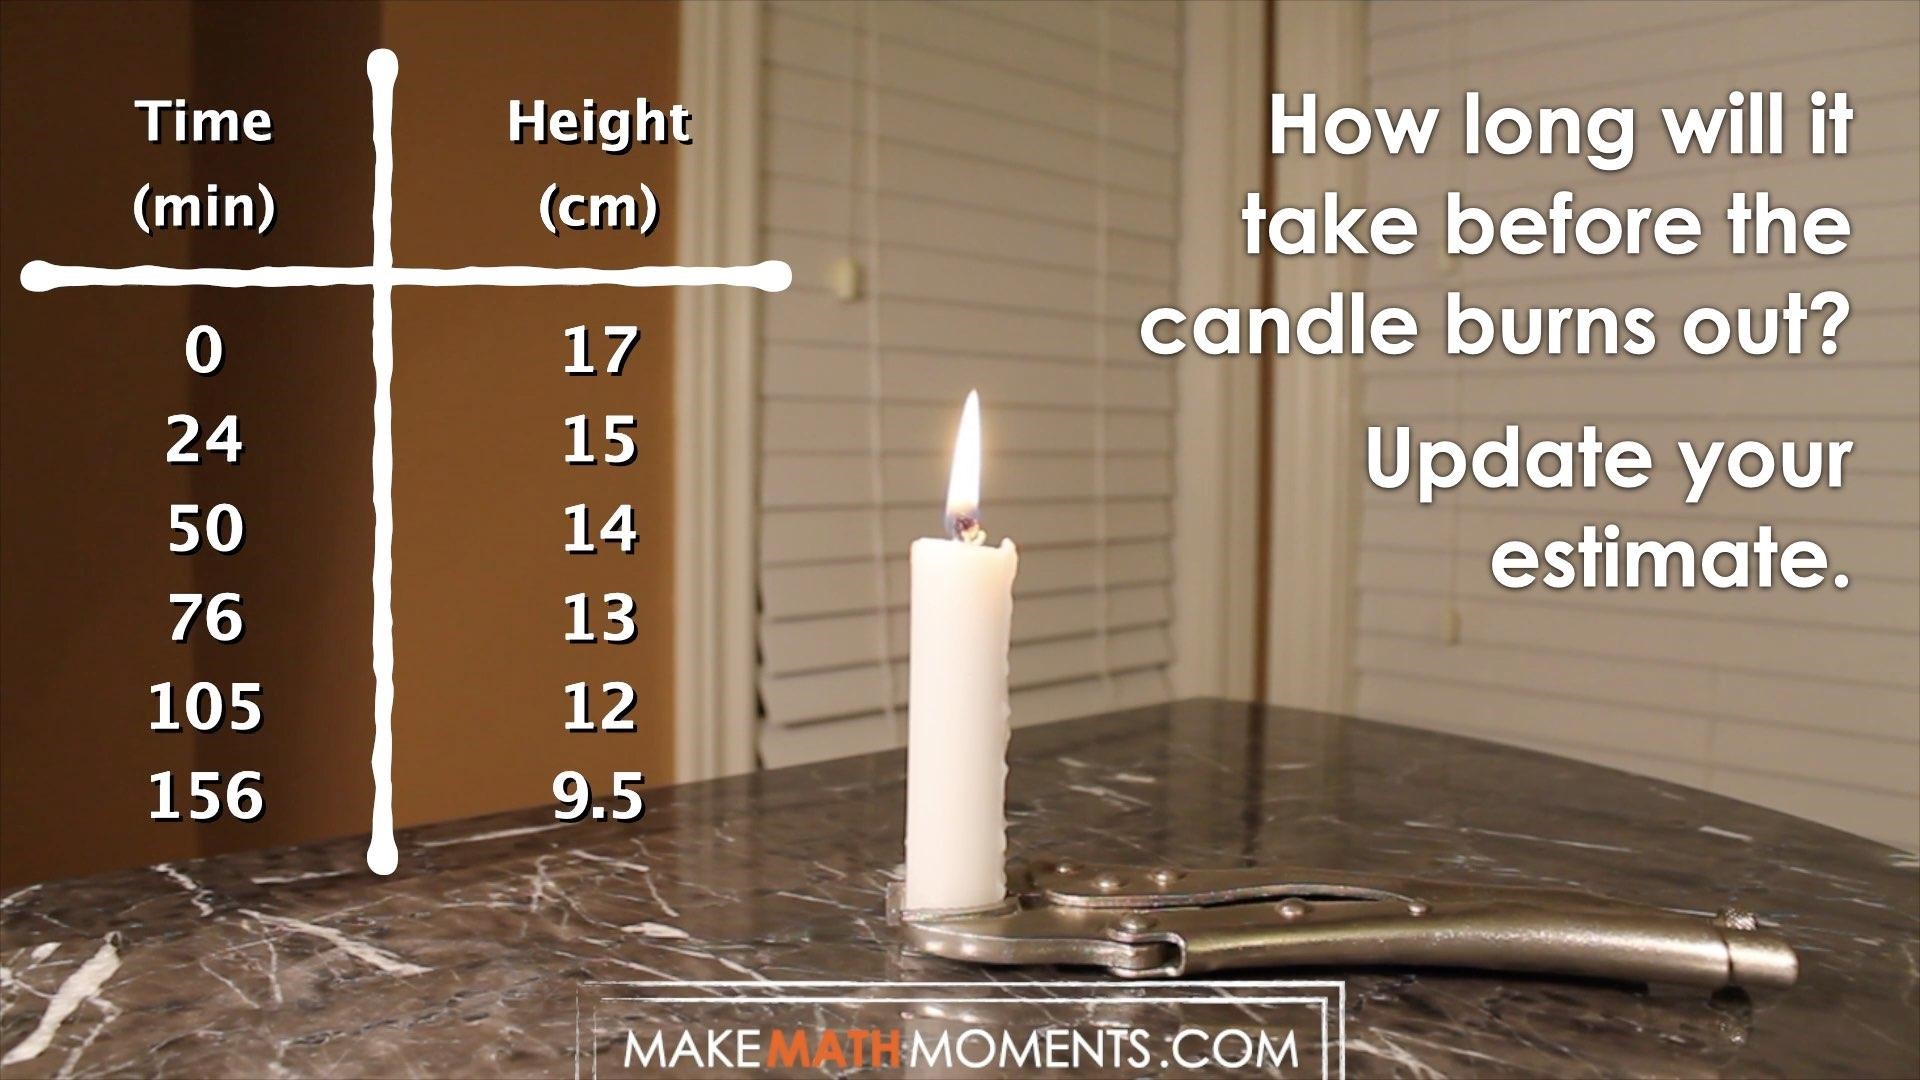
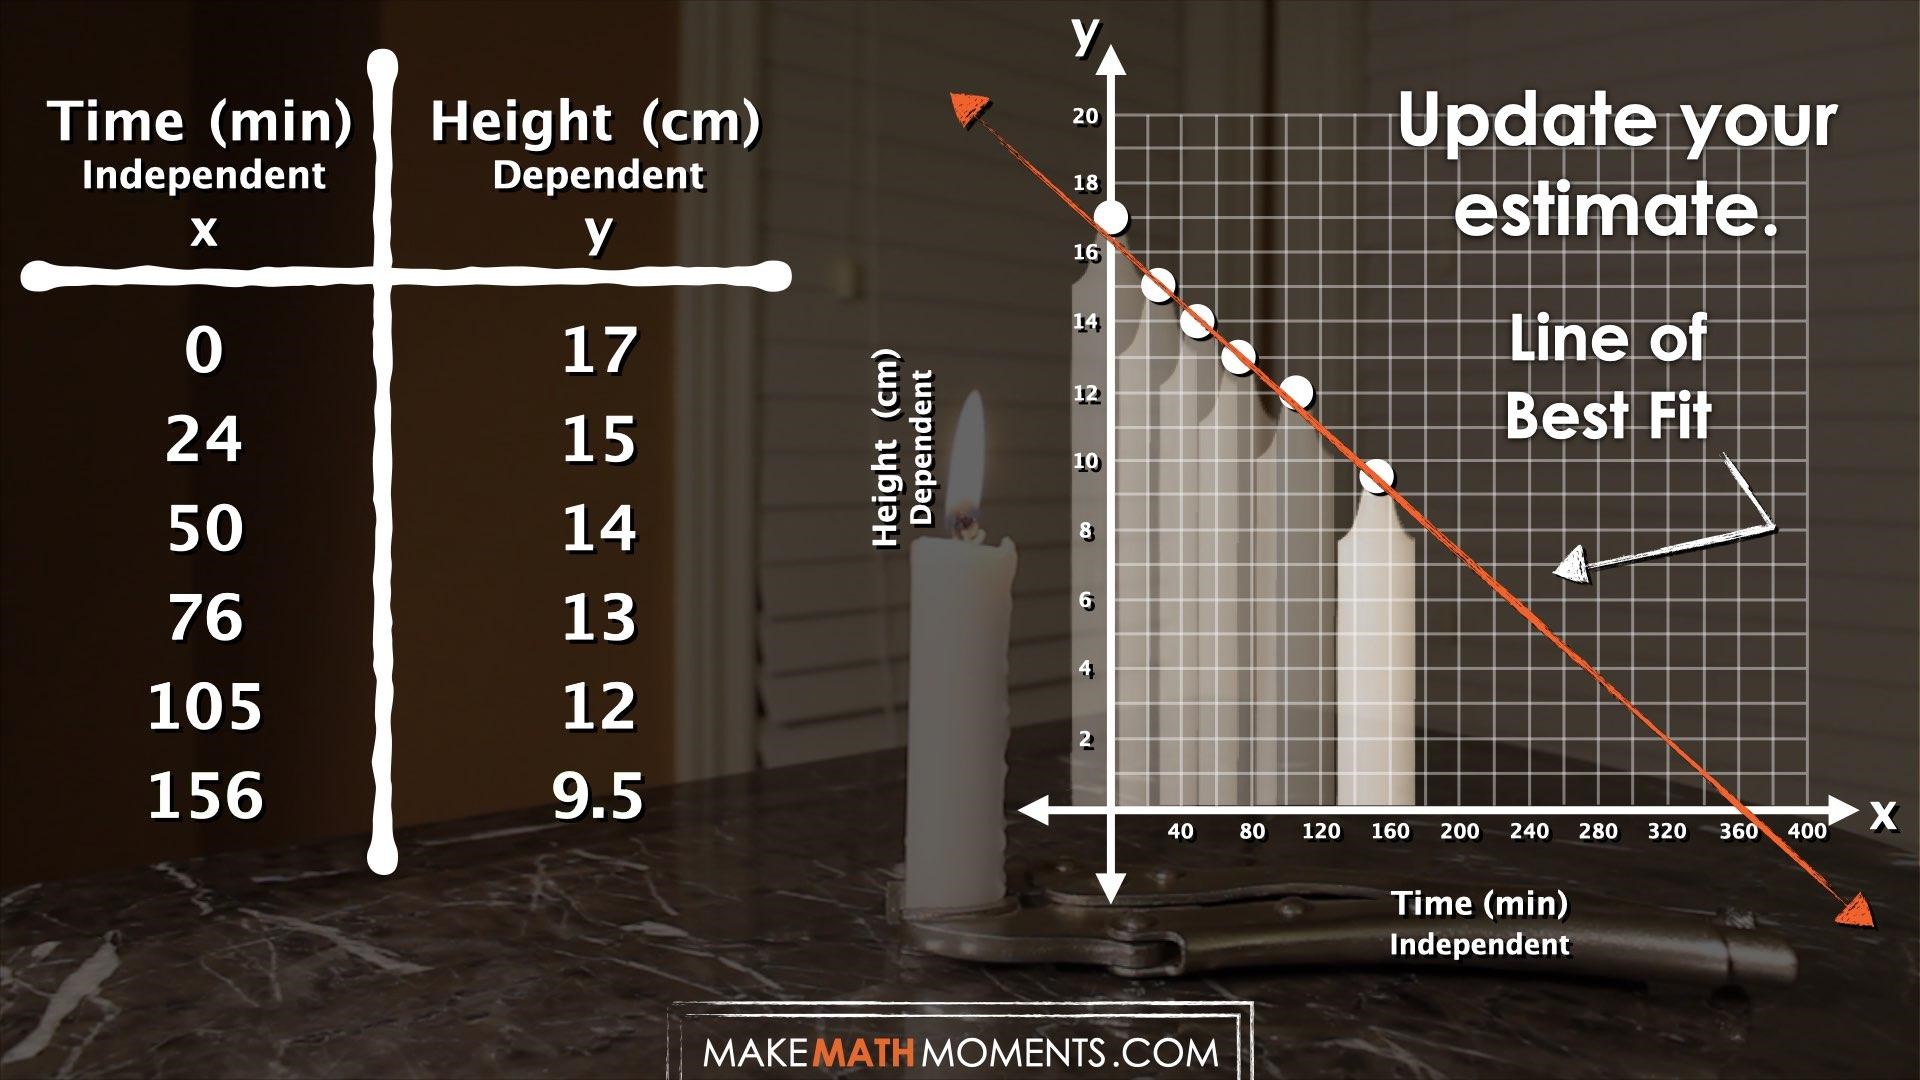
Show the following video that will begin revealing the height of the candle at various points in time as it burns.
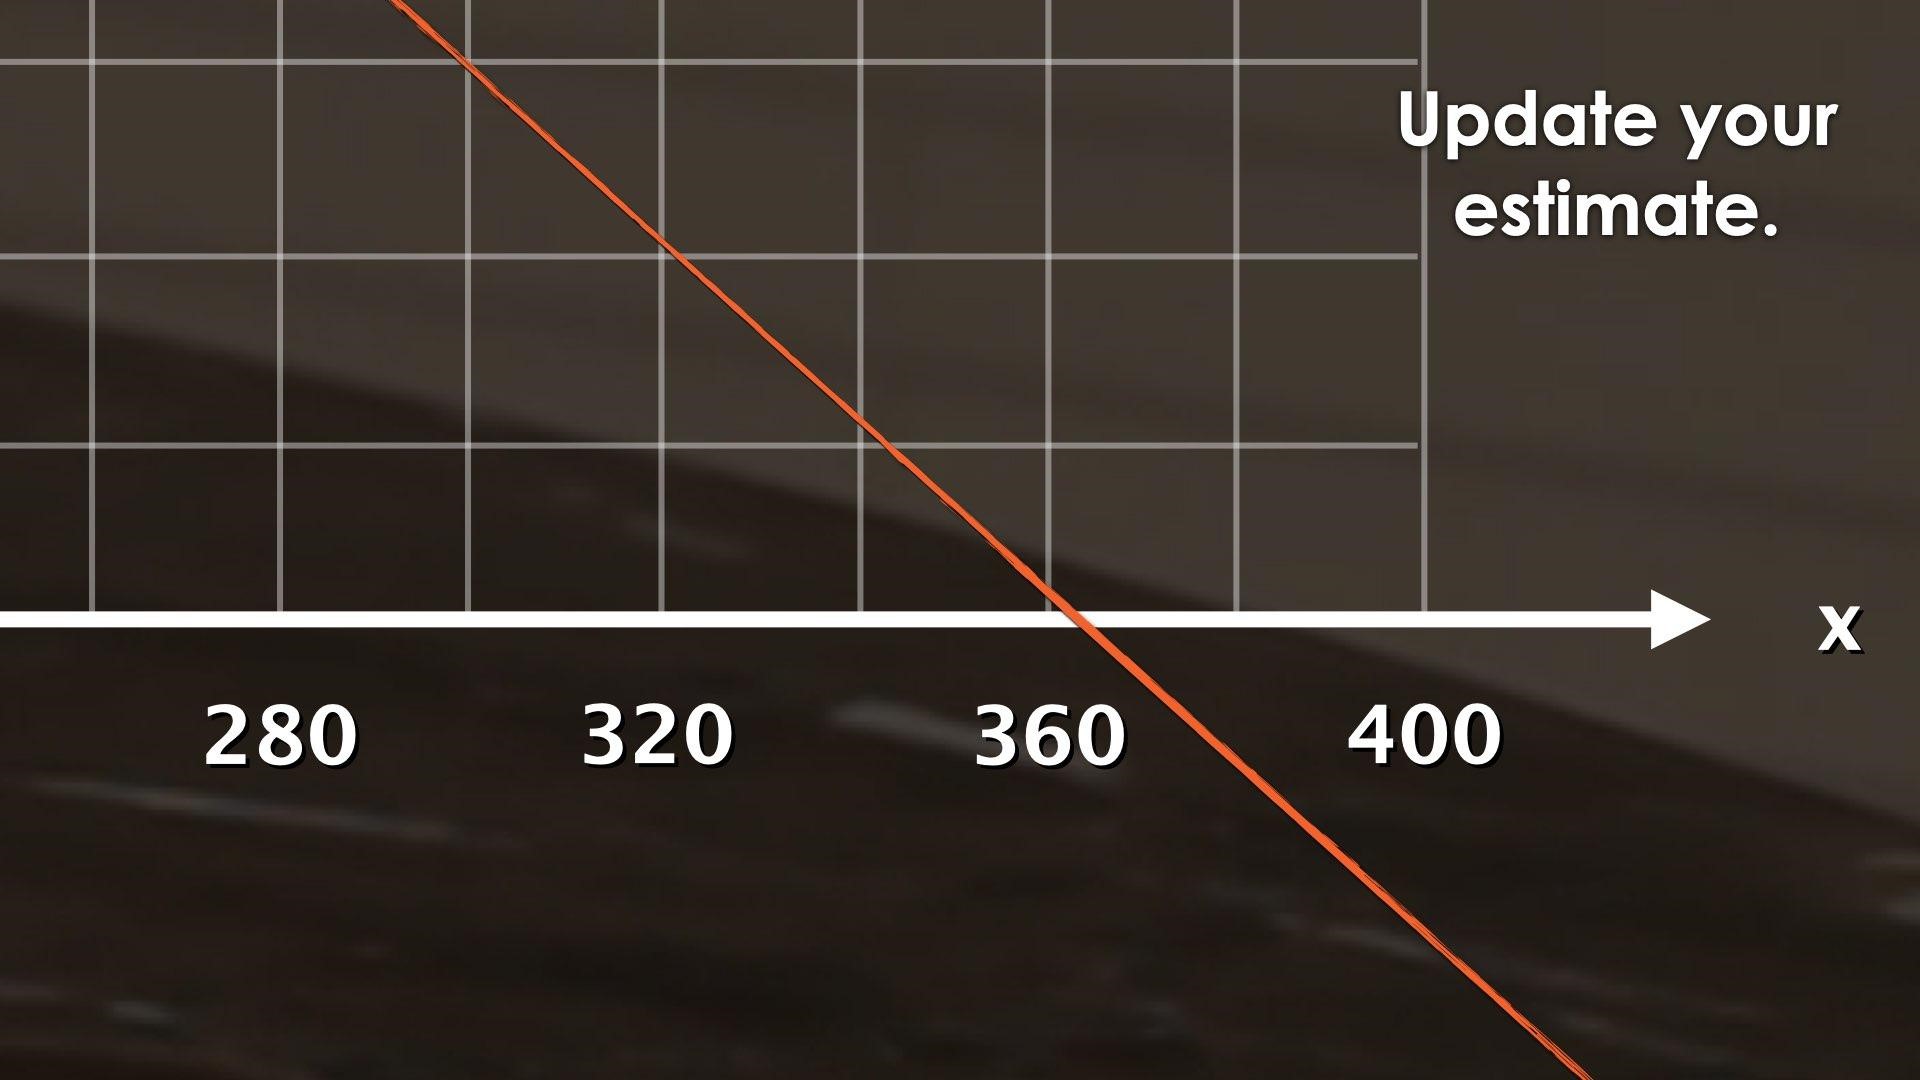
Now that students have been given some data relating the height of the candle and time it is lit, ask students to update their estimates.
How long will it take before the candle burns out?
Update your estimate.
Be sure to remind students that they are not to use a calculator (at least not yet) to update their estimate for how long the candle will take to burn out. Encourage students to use some type of mathematical model in order to communicate their thinking and convince others of their thinking.
Facilitator Note: While there will be an opportunity to provide students with a lesson template that provides a table and grid for graphing in the Consolidation section of the lesson, we want to ensure students are given enough time to use their own strategies and tools to leverage and strengthen their problem solving skills.
Student Approach #1: Reasoning Multiplicatively
I noticed that it took 156 minutes for just under half of the candle to burn, so I’d expect that it will take at least double that time for it to burn out completely.
Double 156 minutes is 312 minutes. Since the candle hadn’t burned to the half way point yet, I’ll add maybe 40 or 50 minutes.
My updated estimate is 355 minutes.
Student Approach #2: Approximating a Ratio And Extrapolating
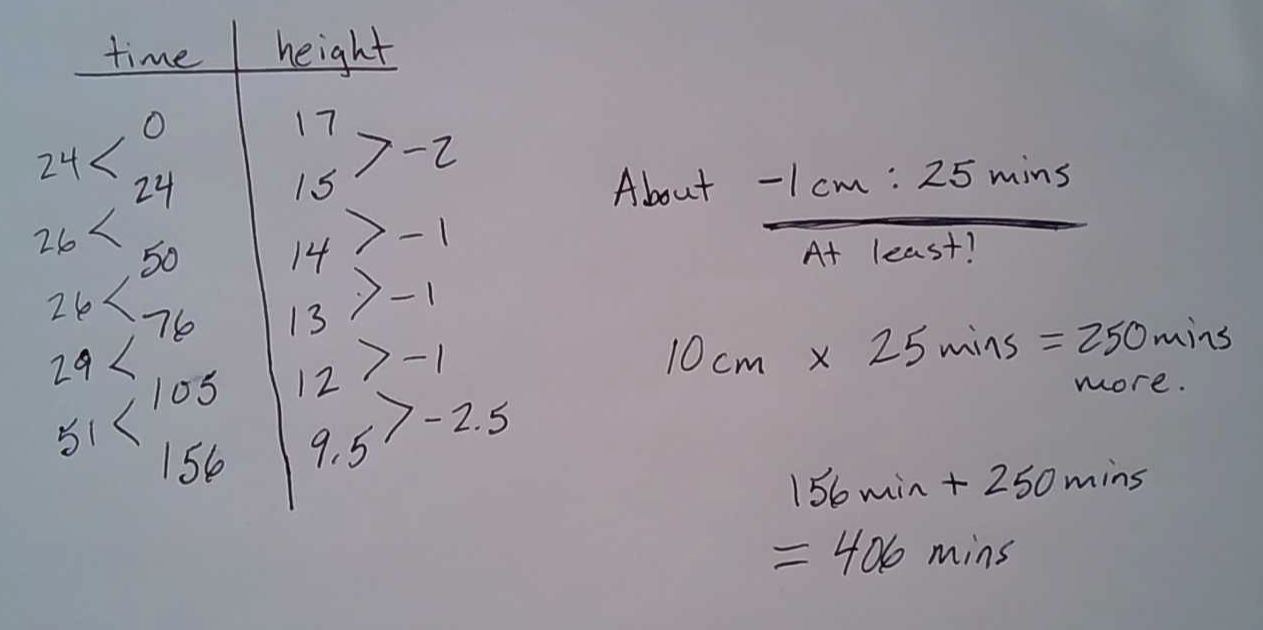
It looked like the candle was burning about 1 to 2 centimetres every 25 minutes or so. If we have about 10 cm left of the candle to go, I multiplied 25 minutes by 10 cm to get 250 minutes of burn time left.
156 minutes + 250 minutes was 406 minutes total.
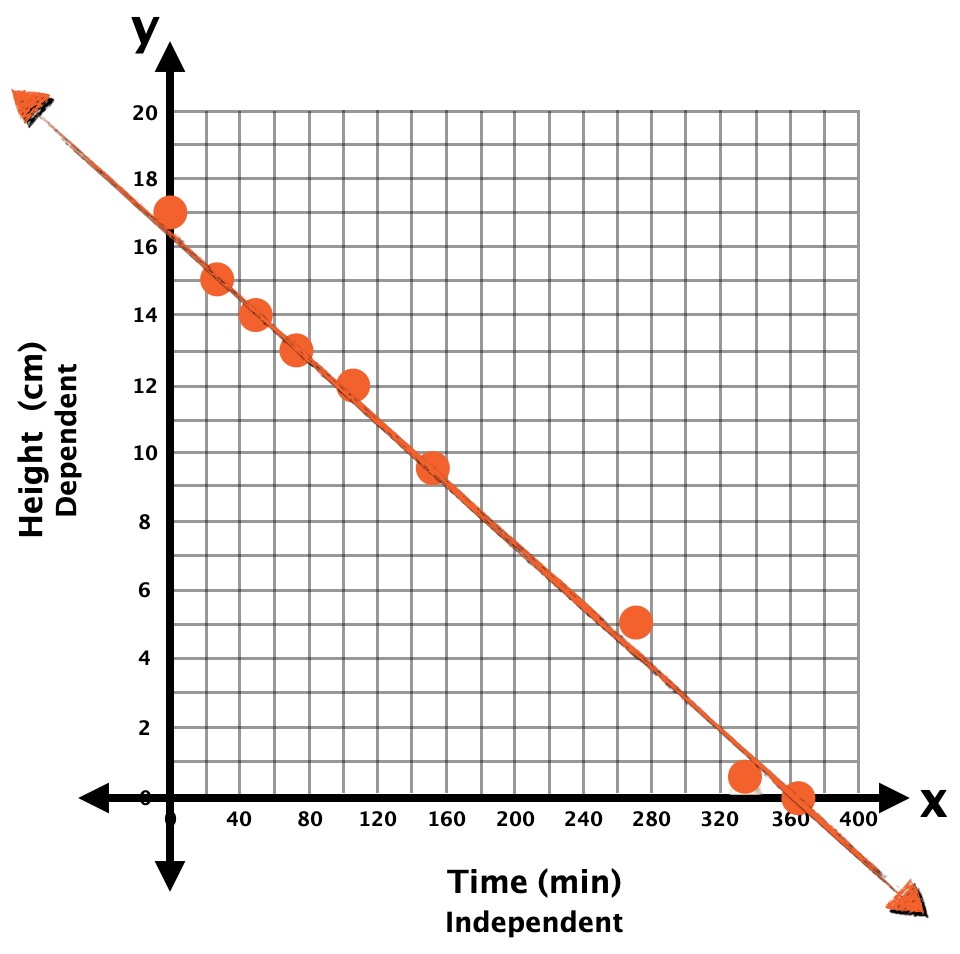
Student Approach #3: Graph Sketch to Extrapolate
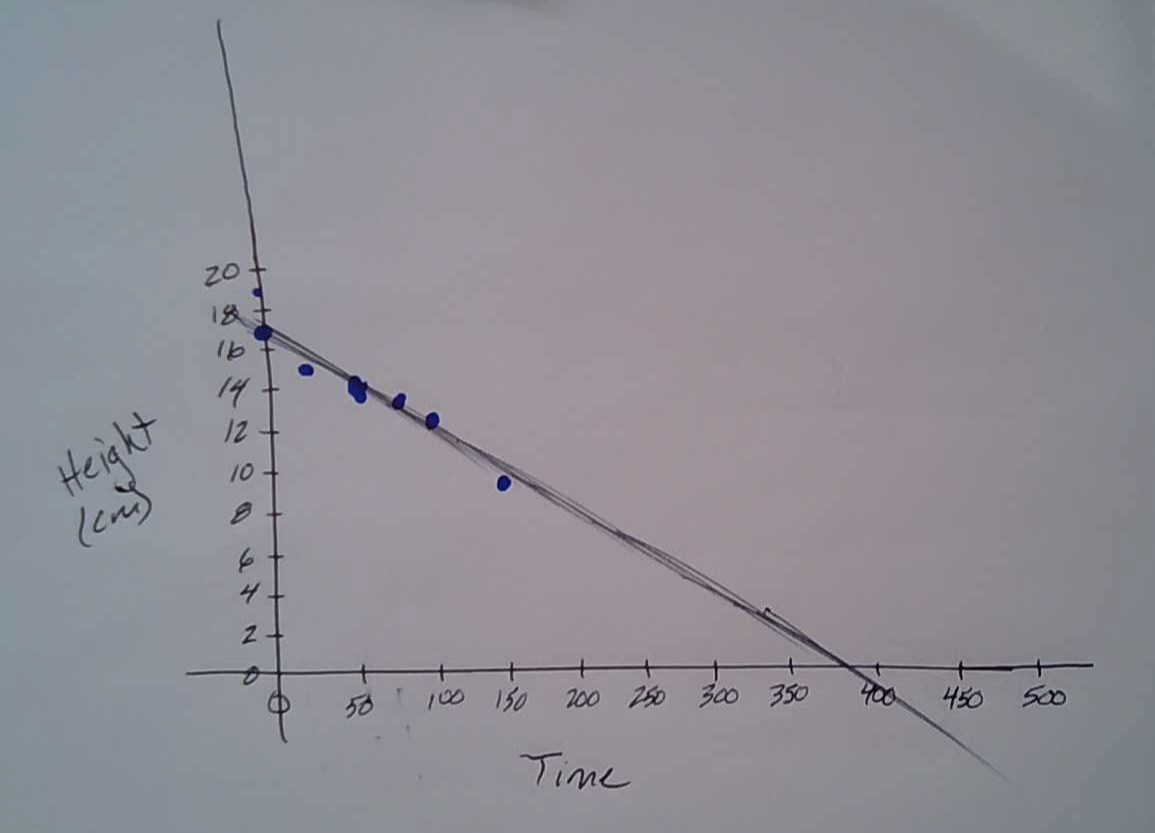
I sketched a rough graph to see if there was a trend. You could see that it was following a pretty straight path so I just followed where the points would likely go next and can see it was about 375 minutes for the candle to reach a height of 0 cm (or burn out).
Reveal
Show students the following reveal video:
Here is an image of the final frame of the reveal video:

During the consolidation, you should find ways to share student thinking based on how they reasoned using multiplicative thinking such as Student Approaches #1 and 2.
If a student leveraged sketching a graph similar to what was shown with Student Approach #3, consider using that graph as a means to prompt all students to improve their predictions or confirm their prediction by drawing their own graph.
Consider sharing the lesson template and consolidation prompt BLM with students so they can complete their table and graph on a grid to increase precision.
Encourage students to leverage the section at the top of the template to jot down any important details that they might not remember tomorrow, next week or next month.
After students have had the opportunity to sketch their graphs and update their estimates based on their original approach and now with the scatter plot graph they have now crafted.
Ask students:
What is your updated estimate now?
How confident are you at this point?
You could encourage students to give a rating of how confident they are out of 10 or out of 100. Not only does this give students yet another opportunity to feel a part of the mathematics, but also gives you a sense of how trusting of the mathematics students are feeling at this point in their journey.
Consider leveraging the slide deck or the following silent solution animation video to help you consolidate how to construct a scatter plot and to explicitly highlight the importance of leveraging a line (or curve) of best fit when visualizing trends in two-variable data.
Be sure to explicitly highlight the role the independent variable plays on the dependent variable in this case and why the independent goes in the left column of the table and also appears on the horizontal axis of the graph.
Encourage students to notice that it is difficult to craft a “perfect” line of best fit when graphing by hand as we are human. Therefore, look to your neighbours and make extrapolations based on what you see on your graph, your neighbours graph and even the graph that we are showing up on the screen.
By trying to average the results from different hand drawn graphs, we can potentially land on a more precise extrapolation for when the candle will likely burn out.
Provide students an opportunity to reflect on their learning by offering this consolidation prompt to be completed independently.
Consolidation Prompt #1:
In the Candle Burning context, time is the independent variable and height of the candle is the dependent.
Why does the height of the candle depend on time rather than time depending on the height of the candle?
Consolidation Prompt #2:
Describe and classify the relationship that exists between the two variables, height and time by circling the following:
- As time increases, the candle’s height [INCREASES or DECREASES]
- The relationship is [RISING or FALLING] to the right
- The relationship is [POSITIVE or NEGATIVE]
- The relationship is [STRONG or WEAK]
Consolidation Prompt #3:
- Use the graph of the relationship to predict the height of the candle after being lit for 200 minutes. and plot your prediction on the graph.
- An interpolation is a prediction made between given data points, while an extrapolation is a prediction made outside (before/after) given data points.
- Would your prediction after 200 minutes be an interpolation or an extrapolation?
Consolidation Prompt #4:
What does the point (76, 13) represent in this situation?
Explain.
We suggest collecting this reflection as an additional opportunity to engage in the formative assessment process to inform next steps for individual students as well as how the whole class will proceed.