Chunking Graphing Stories into 3 Act Math Tasks
Dan Meyer and BuzzMath worked collaboratively with a group of math teachers to create some really impressive resources for distance-time and many other relationships comparing a dependent variable over time. For the past couple years I have been using the videos on the Graphing Stories website and really enjoying how the videos engage my students in ways I had never considered. However, over time, I have been trying to do a better job developing the question as Dan Meyer and many others discussed here. My thinking was that we could develop the question more effectively if we chunked the Graphing Stories videos into 3 acts. So that’s what I did and I’d like to share those videos chunked into 3 acts with you below.
Quick Tip: I’d recommend only using a few of these graphing stories each day as anything too repetitive will lose effectiveness. Spacing out your distance-time work with Graphing Stories over a few weeks seems to work well in my own classroom.
Bum Height off the Ground
Carey Lehner
In Bum Height off the Ground, Carey Lehner submits a video of a child sliding down a large theme park slide. What does the graphing story look like when you compare bum height and time?
Act 1
Act 2
Act 3
Distance From Bench
Kenneth Lawler
In Act 1, Kenneth Lawler submits a video of a weight lifter bench pressing. What does the graphing story look like when you compare the distance of the bar from the bench and time?
Act 1
Watch the other acts below:
Distance From Camera
Adam Poetzel
In Act 1, Adam Poetzel submits a video of a man sitting on the edge of a playground ride. What does the graphing story look like when you compare distance from camera and time?
Act 1
Watch the other acts below:
Air Pressure
Adam Poetzel
In Act 1, Paul Reimer submits a video of a man pumping a football with an air pump. What does the graphing story look like when you compare air pressure and time?
Act 1
Watch the other acts below:
Balloon Length
John Golden
John Golden submits a video of a man blowing up a balloon. What does the graphing story look like when you compare balloon length and time?
Act 1
Watch the other acts below:
Distance From the Centre of the Carousel
Adam Poetzel
Adam Poetzel submits a video of a man sitting on the edge of a carousel. What does the graphing story look like when you compare the distance from centre of the carousel and time?
Act 1
Watch the other acts below:
Distance From Home Plate
Liam Johnston
Liam Johnston submits a video of a man running the bases of a baseball diamond. What does the graphing story look like when you compare distance from home plate and time?
Act 1
Watch the other acts below:
Elevation
Arianna Hoshino
Arianna Hoshino submits a video of a man rolling down a hill. What does the graphing story look like when you compare elevation and time?
Act 1
Watch the other acts below:
Elevation of Paper Plane
Jose Luis Ibarra
Jose Luis Ibarra submits a video of a person flying a paper plane from the second floor of a building. What does the graphing story look like when you compare elevation and time?
Act 1
Watch the other acts below:
Height
Jean Phillipe Choiniere
Jean Phillipe Choiniere submits a video of a person zip-lining in the rain forrest. What does the graphing story look like when you compare height off ground and time?
Act 1
Watch the other acts below:
Height of Ball
Rachel Falknor
Rachel Falknor submits a video of a person bouncing a ball on the ground. What does the graphing story look like when you compare height and time?
Act 1
Watch the other acts below:
Height of Stack
Mark Sloan
Mark Sloan submits a video of a person stacking styrofoam cups. What does the graphing story look like when you compare height of stack and time?
Act 1
Watch the other acts below:
Height of Waist Off The Ground
Adam Poetzel
Adam Poetzel submits a video of a person climbing up a slide and then sliding down. What does the graphing story look like when you compare height of waist off ground and time?
Act 1
Watch the other acts below:
Height of Waist Off The Ground
Dan Meyer
Dan Meyer submits a video of himself swinging on a swing. What does the graphing story look like when you compare height of waist off ground and time?
Act 1
Watch the other acts below:
Height Off The Ground
Bowen Kerins
Bowen Kerins submits a video of a video game character using a teleport on the screen. What does the graphing story look like when you compare height off ground and time?
Act 1
Watch the other acts below:
Ponies in Frame
Christopher Danielson
Christopher Danielson submits a video of a person adding pony figurines to the frame. What does the graphing story look like when you compare the number of ponies in the frame and time?
Act 1
Watch the other acts below:
Size of Hand
David Cox
David Cox submits a video of a person dealing out a deck of cards. What does the graphing story look like when you compare the size of hand and time?
Act 1
Watch the other acts below:
Time
Mariah Thompson
Mariah Thompson submits a video of a person holding a clock and watching the time go by. What does the graphing story look like when you compare the time on the clock and the time on the timer?
Act 1
Watch the other acts below:
Water Volume
Esteban Diaz Ibarra
Esteban Diaz Ibarra submits a video of a person filling a cylinder with water. What does the graphing story look like when you compare the volume of water and time?
Act 1
Watch the other acts below:
Weight of Stack
Mark Sloan
Mark Sloan submits a video of a person stacking cups on a scale. What does the graphing story look like when you compare the weight of the stack and time?
Act 1
Watch the other acts below:
Weight of Stack Part 2
Mark Sloan
Mark Sloan submits a video of a person un-stacking cups on a scale. What does the graphing story look like when you compare the weight of the stack and time?
Act 1
Watch the other acts below:
Weight of Stack of Mixed Cups
Mark Sloan
Mark Sloan submits a video of a person stacking different kinds of cups on a scale. What does the graphing story look like when you compare the weight of the stack and time?
Act 1
Watch the other acts below:
All of the video content originally licensed CC BY 3.0 US on the Graphing Stories website by Dan Meyer, BuzzMath and a group of excellent teachers.
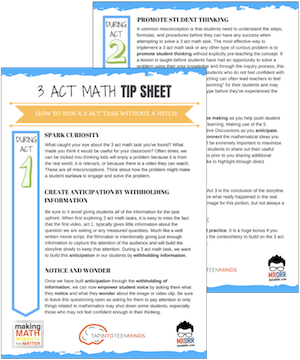
New to Using 3 Act Math Tasks?
Download the 2-page printable 3 Act Math Tip Sheet to ensure that you have the best start to your journey using 3 Act math Tasks to spark curiosity and fuel sense making in your math classroom!
Share With Your Learning Community:

About Kyle Pearce
I’m Kyle Pearce and I am a former high school math teacher. I’m now the K-12 Mathematics Consultant with the Greater Essex County District School Board, where I uncover creative ways to spark curiosity and fuel sense making in mathematics. Read more.
Access Other Real World Math Tasks
Search More 3 Act Math Tasks
Grade 2 [2.B1.1, 2.B1.3, 2.B2.1, 2.B2.2, 2.B2.3, 2.B2.4, Measurement - M1, Number Sense and Numeration - NS1, Number Sense and Numeration - NS2, Number Sense and Numeration - NS3]
Grade 3 [3.B1.5, 3.B2.1, 3.B2.3, 3.B2.7, Measurement - M1, Number Sense and Numeration - NS1, Number Sense and Numeration - NS3]
Grade 4 [4.B2.1, 4.B2.4, 4.E2.5, 4.E2.6, Measurement - M1, Number Sense and Numeration - NS1, Number Sense and Numeration - NS3, Patterning and Algebra - PA2]
Grade 5 [5.B1.7, 5.B2.9, 5.D1.3, 5.D1.6, 5.E2.6, 5.F1.2, 5.F1.5, Measurement - M1, Measurement - M2, Number Sense and Numeration - NS1, Number Sense and Numeration - NS3, Patterning and Algebra - PA2]
Grade 6 [6.B2.12, 6.B2.9, Data Management and Probability - DP3, Measurement - M1, Measurement - M2, Number Sense and Numeration - NS1, Number Sense and Numeration - NS2, Number Sense and Numeration - NS3, Patterning and Algebra - PA1, Patterning and Algebra - PA2]
Grade 7 [7.B1.3, 7.B1.4, 7.B1.7, 7.B2.2, 7.B2.3, 7.C1.1, 7.C1.2, 7.C1.3, 7.C1.4, 7.D1.6, Data Management and Probability - DP3, Geometry and Spatial Sense - GS1, Measurement - M1, Measurement - M2, Number Sense and Numeration - NS1, Number Sense and Numeration - NS2, Number Sense and Numeration - NS3, Patterning and Algebra - PA1, Patterning and Algebra - PA2]
Grade 8 [8.B1.4, 8.B2.5, 8.C1.1, 8.C1.2, 8.C1.3, 8.C1.4, Data Management and Probability - DP1, Data Management and Probability - DP3, Geometry and Spatial Sense - GS2, Measurement - M1, Measurement - M2, Number Sense and Numeration - NS1, Number Sense and Numeration - NS2, Number Sense and Numeration - NS3, Patterning and Algebra - PA1, Patterning and Algebra - PA2]
Grade 9 [9.B3.5, 9.C3.1, 9.C3.2, 9.C3.3]
Kindergarten [k.15.1, k.15.10, k.15.2]
MAP4C [Mathematical Models - MM1, Mathematical Models - MM2, Mathematical Models - MM3]
MAT1LMAT2LMBF3C [Data Management - DM1, Data Management - DM2, Geometry and Trigonometry - GT1, Geometry and Trigonometry - GT2, Mathematical Models - MM1, Mathematical Models - MM2, Mathematical Models - MM3]
MCF3M [Exponential Functions - EF2, Quadratic Functions - QF1, Quadratic Functions - QF2, Quadratic Functions - QF3, Trigonometric Functions - TF1, Trigonometric Functions - TF3]
MCR3U [Characteristics of Functions - CF1, Characteristics of Functions - CF2, Exponential Functions - EF2, Exponential Functions - EF3, Trigonometric Functions - TF3]
MCT4C [Exponential Functions - EF1, Trigonometric Functions - TF3]
MCV4U [Derivatives and Their Applications - DA2]
MDM4U [Counting and Probability - CP2, Organization of Data For Analysis - DA2, Probability Distributions - PD1, Statistical Analysis - SA1, Statistical Analysis - SA2]
MEL4EMFM1P [Linear Relations - LR1, Linear Relations - LR2, Linear Relations - LR3, Linear Relations - LR4, Measurement and Geometry - MG1, Measurement and Geometry - MG2, Measurement and Geometry - MG3, Number Sense and Algebra - NA1, Number Sense and Algebra - NA2]
MFM2P [Measurement and Trigonometry - MT1, Measurement and Trigonometry - MT2, Measurement and Trigonometry - MT3, Modelling Linear Relations - LR1, Modelling Linear Relations - LR2, Modelling Linear Relations - LR3, Quadratic Relations in y = ax^2 + bx + c Form - QR1, Quadratic Relations in y = ax^2 + bx + c Form - QR2, Quadratic Relations in y = ax^2 + bx + c Form - QR3]
MHF4U [Characteristics of Functions - CF3, Exponential and Logarithmic Functions - EL2, Exponential and Logarithmic Functions - EL3]
MPM1D [AG3, Analytic Geometry - AG1, Analytic Geometry - AG2, LR1, LR2, LR3, MG1, MG2, MG3, NA1, Number Sense and Algebra - NA2]
MPM2D [AG1, AG2, AG3, QR2, Quadratic Relations - QR3, Quadratic Relations - QR4, T2, T3]
Functions [F-BF.1, F-BF.3, F-IF.4, F-LE.1, F-LE.2, F-LE.3, F-TF.5]
Geometry [G-C.5, G-C.8, G-C.9, G-GMD.3, G-GMD.4, G-GPE.4, G-GPE.5, G-GPE.7, G-MG.1, G-MG.2, G-SRT.11]
Grade 1 [1.NBT.4, 1.OA.1, 1.OA.6, 1.OA.A.1, 1.OA.B.3, 1.OA.B.4, 1.OA.C.5, 1.OA.C.6]
Grade 2 [2.NBT.5, 2.NBT.B.5, 2.NBT.B.8, 2.NBT.B.9, 2.OA.2, 2.OA.A.1, 2.OA.B.2]
Grade 3 [3.MD.C.5, 3.NBT.2, 3.NF.1, 3.NF.2, 3.NF.3, 3.NF.A.1, 3.OA.1, 3.OA.5, 3.OA.9]
Grade 4 [4-MD.3, 4.MD.1, 4.MD.2, 4.NBT.6, 4.NF.3, 4.NF.5, 4.NF.6, 4.OA.1, 4.OA.5]
Grade 5 [5.B1.7, 5.D1.3, 5.D1.6, 5.MD.1, 5.MD.3, 5.MD.4, 5.MD.5, 5.NBT.2, 5.NBT.3, 5.NBT.6, 5.NBT.7, 5.NF.1, 5.NF.2, 5.NF.3, 5.NF.4, 5.NF.5, 5.OA.1, 5.OA.2, 5.OA.3]
Grade 6 [6.EE.1, 6.EE.2, 6.EE.5, 6.EE.6, 6.EE.7, 6.G.1, 6.G.2, 6.NS.1, 6.NS.3, 6.NS.6, 6.NS.B.3, 6.NS.C.6, 6.NS.C.7, 6.NS.C.8, 6.RP.1, 6.RP.2, 6.RP.3, 6.RP.A.1, 6.RP.A.2, 6.RP.A.3, 6.RP.A.3.C]
Grade 7 [7.EE.3, 7.EE.4, 7.EE.A.1, 7.G.3, 7.G.4, 7.G.6, 7.NS.A.1, 7.NS.A.2, 7.RP.1, 7.RP.3, 7.RP.A.2.B, 7.RP.A.3, 7.SP.2, 7.SP.5, 7.SP.6]
Grade 8 [8.EE.1, 8.EE.5, 8.EE.6, 8.EE.7, 8.EE.8, 8.F.2, 8.F.3, 8.F.4, 8.F.5, 8.G.5, 8.G.6, 8.G.7, 8.G.9, 8.SP.1]
Grade 9Kindergarten [K.CC.A.1, K.NBT.A.1, K.OA.A.1, K.OA.A.2, K.OA.A.3]
Practice [MP.1, MP.2, MP.3, MP.4, MP.6, MP.7]
Statistics & Probability [S-ID.6, S-MD.4]
Love love LOVE!!!! So skibidi, as my students would say. My students call me Mr. Cool, and I love your amazing ideas about teaching.