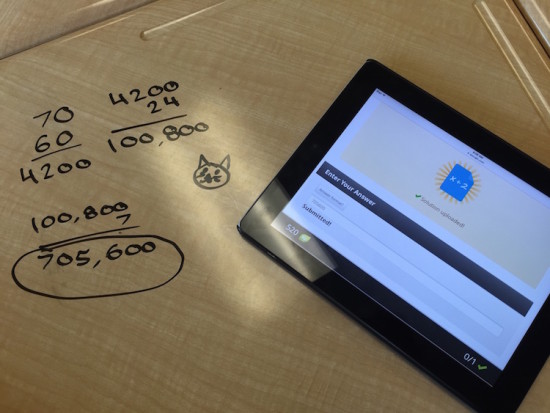
A Weekly Summary of My Math Classroom
Week #1 – September 8th-11th, 2015
I love posting reflections after lessons in my classroom, but often struggle to find the time to do it. This year, I’m going to try to give a short summary of what we were up to during the previous week. It might not be super detailed, but I hope it has enough meat to outline what we are up to in Grade 9 Academic Math at Tecumseh Vista Academy.
While I typically have quite a bit of iPad use in my math class, the new MDM software our district is using provided some issues with getting our apps installed for the first week. We can access the web, but that is about it for now.
So here we go…
Day #1 – Tuesday September 8th, 2015
Stacking Cups
Regardless of how hard I try when planning the first day of school, I always find it flies by way too fast. Since I only teach one class and it is the first one of the day, it seems like interruptions are at a maximum. The past few years I’ve done a pretty good job at really cutting back on my “course information” rant so we can get to some fun and collaborative math.
This year, I thought I’d give the Stacking Cups task shared by Dan Meyer way back in 2008 (but since shared by many others including Andrew Stadel, Jon Orr, Fawn Nguyen, and many others). Although I had heard about the task, I had never really looked into it too closely. I’m glad I did as it was a really great way to get the kids excited on the first day.
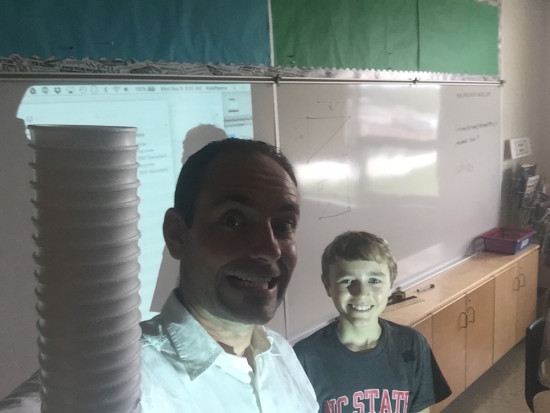
“How many cups would it take to reach my height?”
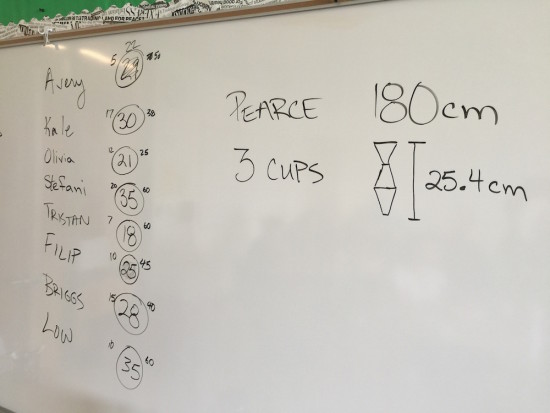
I asked students how many cups it would take to reach my height. I asked them to jot down their best prediction. After about 20 seconds, a hand went up and the question was “how are you stacking them?” To start with a low floor, I said we would be stacking them “bottom-to-bottom” and “top-to-top”.
With that clarified, students made their predictions, we recorded some of them on the board, and then students began asking for more information. After different requests, I decided to give them my height and the height of 3 cups stacked:
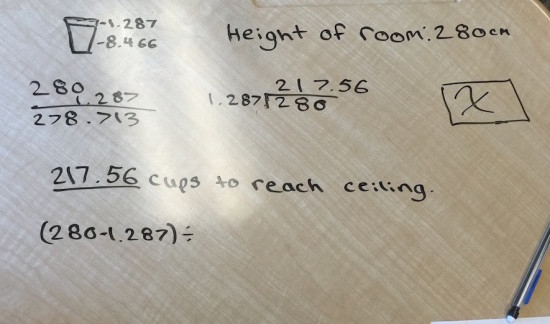
Students immediately went to work and all students came back with approximately 21 cups. We tested their work and although it was difficult to do without taping the cups together, the result looked really good!
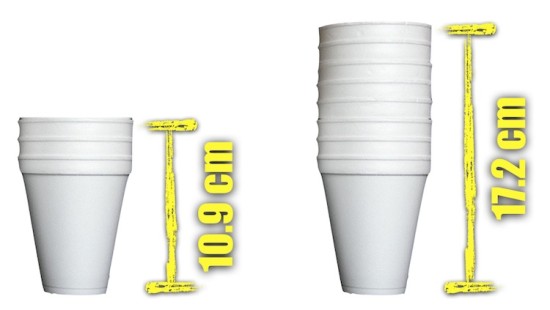
When I glanced at the clock, we were down to less than 5 minutes left in class. So I challenged them to go home that evening and determine how many cups it would take if each cup was stacked inside the next. Here’s the information I gave them to work with:
A few students looked concerned, but I reassured them that this was for me to better understand where we are at and where we should go next in the course. I was excited to see what they came up with.
Day #2 – Wednesday September 9th, 2015
Grade Level Assembly & Stacking Cups Continued…
On the second day, we had the grade level assembly where administration goes over some of the school procedures with students. This took up more than half of the class.
Once we were back, I was curious to see what students came up with for the Stacking Cups task from the previous day. I asked them to take out their solutions, consider improving their communication, and then compare and contrast with neighbours. If you and a neighbour agree, discuss your strategies. Is there an easier way? If you disagree, determine where in your strategy that you went your separate ways.
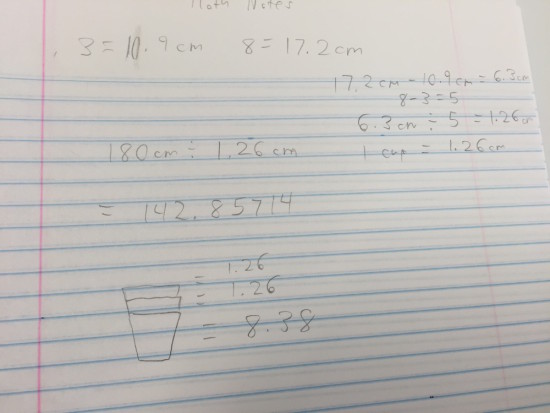
What I was hoping to achieve by doing this was having students intuitively use the slope formula to determine the rate of change of this linear relationship. By giving the height of 3 cups stacked and 8 cups stacked, I have given them two points. Interestingly enough, most students did use the slope formula without knowing it.
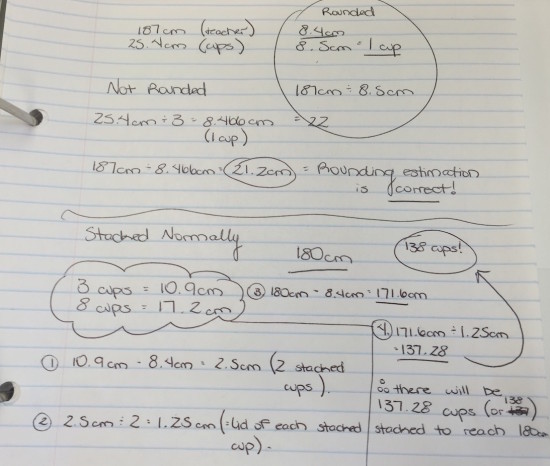
Student Work Samples
This student does a great job of intuitively using the slope formula by subtracting the heights of two stacks of cups (y2 – y1) and subtracting the number of cups (x2 – x1) and then dividing those results to get the height of the “rim” of the cup:
This next student did something similar to the previous, but originally made the error of dividing the height of the teacher by the height of the “lid” without accounting for the height of the base of the first cup:
After crowd-sourcing solutions, we settled on 137 cups stacked to reach my height.
They came pretty close…
Day #3 – Thursday September 10th, 2015
Stacking Cups Equation
The assembly on Wednesday didn’t leave enough time for me to get into creating an equation to help make life a little easier. So once students arrived, I posed the following question to them:
Yesterday, you folks did a great job determining how many cups it would take to reach my height. Today, I’d like you to determine how many it would take to get to the ceiling. However, I want you to devise a way that will let you “cheat” to get to the answer without doing all kinds of work. GO!
Students were discussing what I meant by cheat and eventually, we discussed as a class that I was looking for an equation.
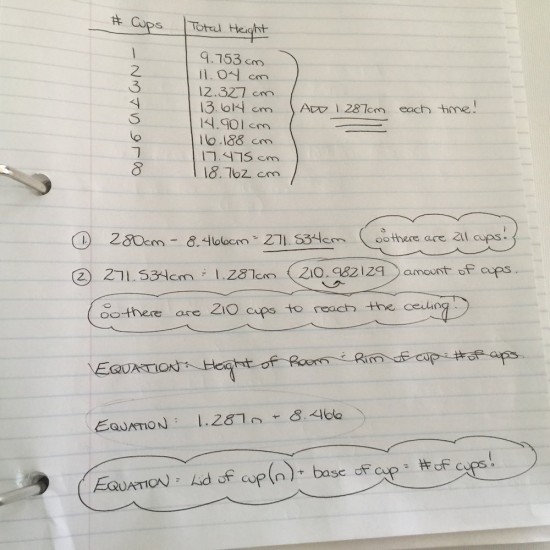
This student was onto something:
This student used the table of values to find the rate of change/slope and then basically created an equations using words to determine how many cups:
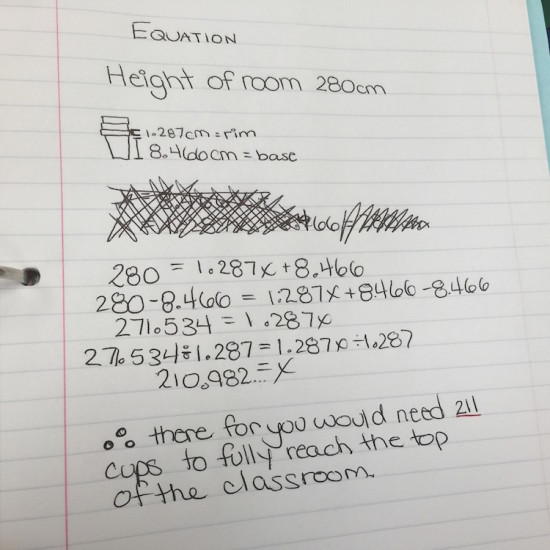
And then, there was also this student who went straight for a linear equation and did a fantastic job of solving it algebraically:
We had a great discussion to consolidate the different strategies used and why an equation was so valuable to us.
Baby Beats
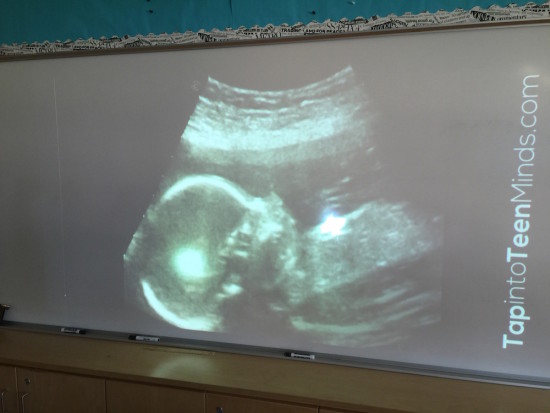
We then introduced the Baby Beats 3 Act Math Task that begins with the following video:
After asking students to share out what questions come to mind, I guide them to the most obvious question:
Does this baby have a healthy heart rate?
After act 2 is shown, students now know that the baby’s heart beat 18 times in 7.12 seconds. Then, they’re off to work!
Student Exemplars:
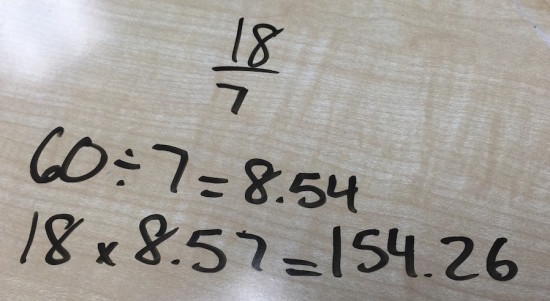
It appears that this first student determined how many groups of 7 seconds there are in 60 seconds. Since there is 18 beats for every 7 seconds, he can then multiply the number of 7 second groups by 18:
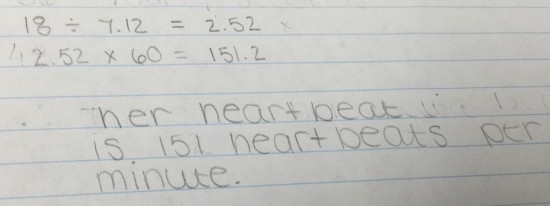
Another student goes the unit rate approach by determining how many beats per second we should expect:
After consolidating this task, students were given a math task template to extend their thinking to a table, graph and some learning goals related to correlation.
Day #4 – Friday September 11th, 2015
Knowledgehook Sign-Up & Baby Beats Gameshow
Today, we spent some time taking up the Baby Beats math task template that was given near the end of class yesterday. Because I have been really trying to spiral content over the past 8 months or so, I often include some concepts that students have not been explicitly taught. My intention here is to use this approach as a sort of diagnostic, without the negatives associated with a formal diagnostic “test”. Because academic students are usually very hard workers and grade conscious, I know it will take some time for them to become comfortable with the process. When you are not used to struggling or failing at anything in the classroom, it can make one very uncomfortable.
After we spent some good time discussing the math task template, I had students create their Knowledgehook accounts that we will be using on a regular basis to take advantage of their Gameshow and Homework features. Students in my grade 9 applied course last year really enjoyed this tool last year, so I’m interested to see how my academic students feel.
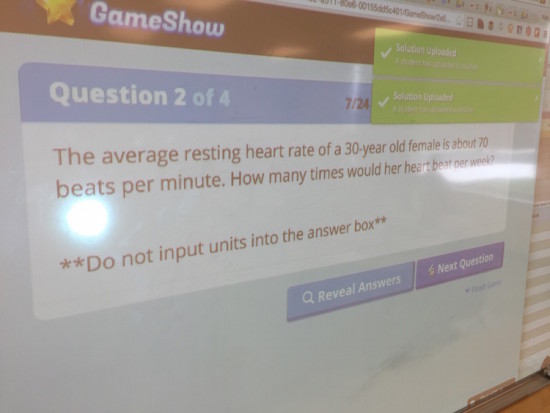
Once students were in and I had a chance to explain what a “Gameshow” was, I ran the Baby Beats Custom Gameshow that include extension questions I had created for them.
By using the Embed Tool, I am able to allow you to check out and participate in the very same Gameshow. Feel free to check it out below:
Something to note is that currently, Gameshows that are embedded in websites do not have the “Upload Solution” feature active. This is my favourite part about Gameshow. Students can upload a photo or screenshot of their work and we can share them out over the projector to consolidate each question. I can also access these solutions afterwards to make this formative assessment tool more than just multiple choice. Good stuff!
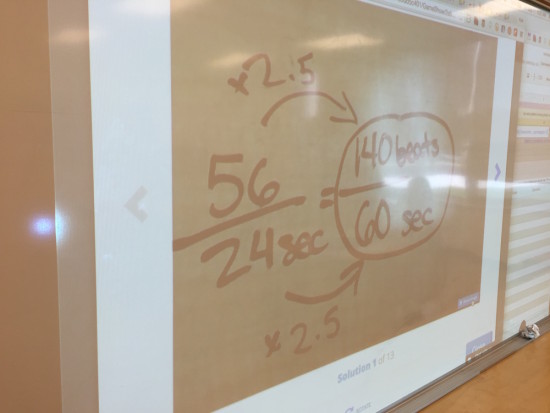
We spent some good time on different solutions such as these:
The Knowledgehook “Share Your Solution” feature allowed us to consolidate the concept of solving proportions without me doing a lesson with explicit instructions and steps for this learning goal over the data projector. Great!
With approximately 15 minutes remaining, I decided to wait on the Candle Burning 3 Act Math Task until Monday and opted to give students a bit more practice with equivalent fractions, proportions, graphing, and correlation with this math task template.
That’s it for this week! Looking forward to sharing with you again next week!
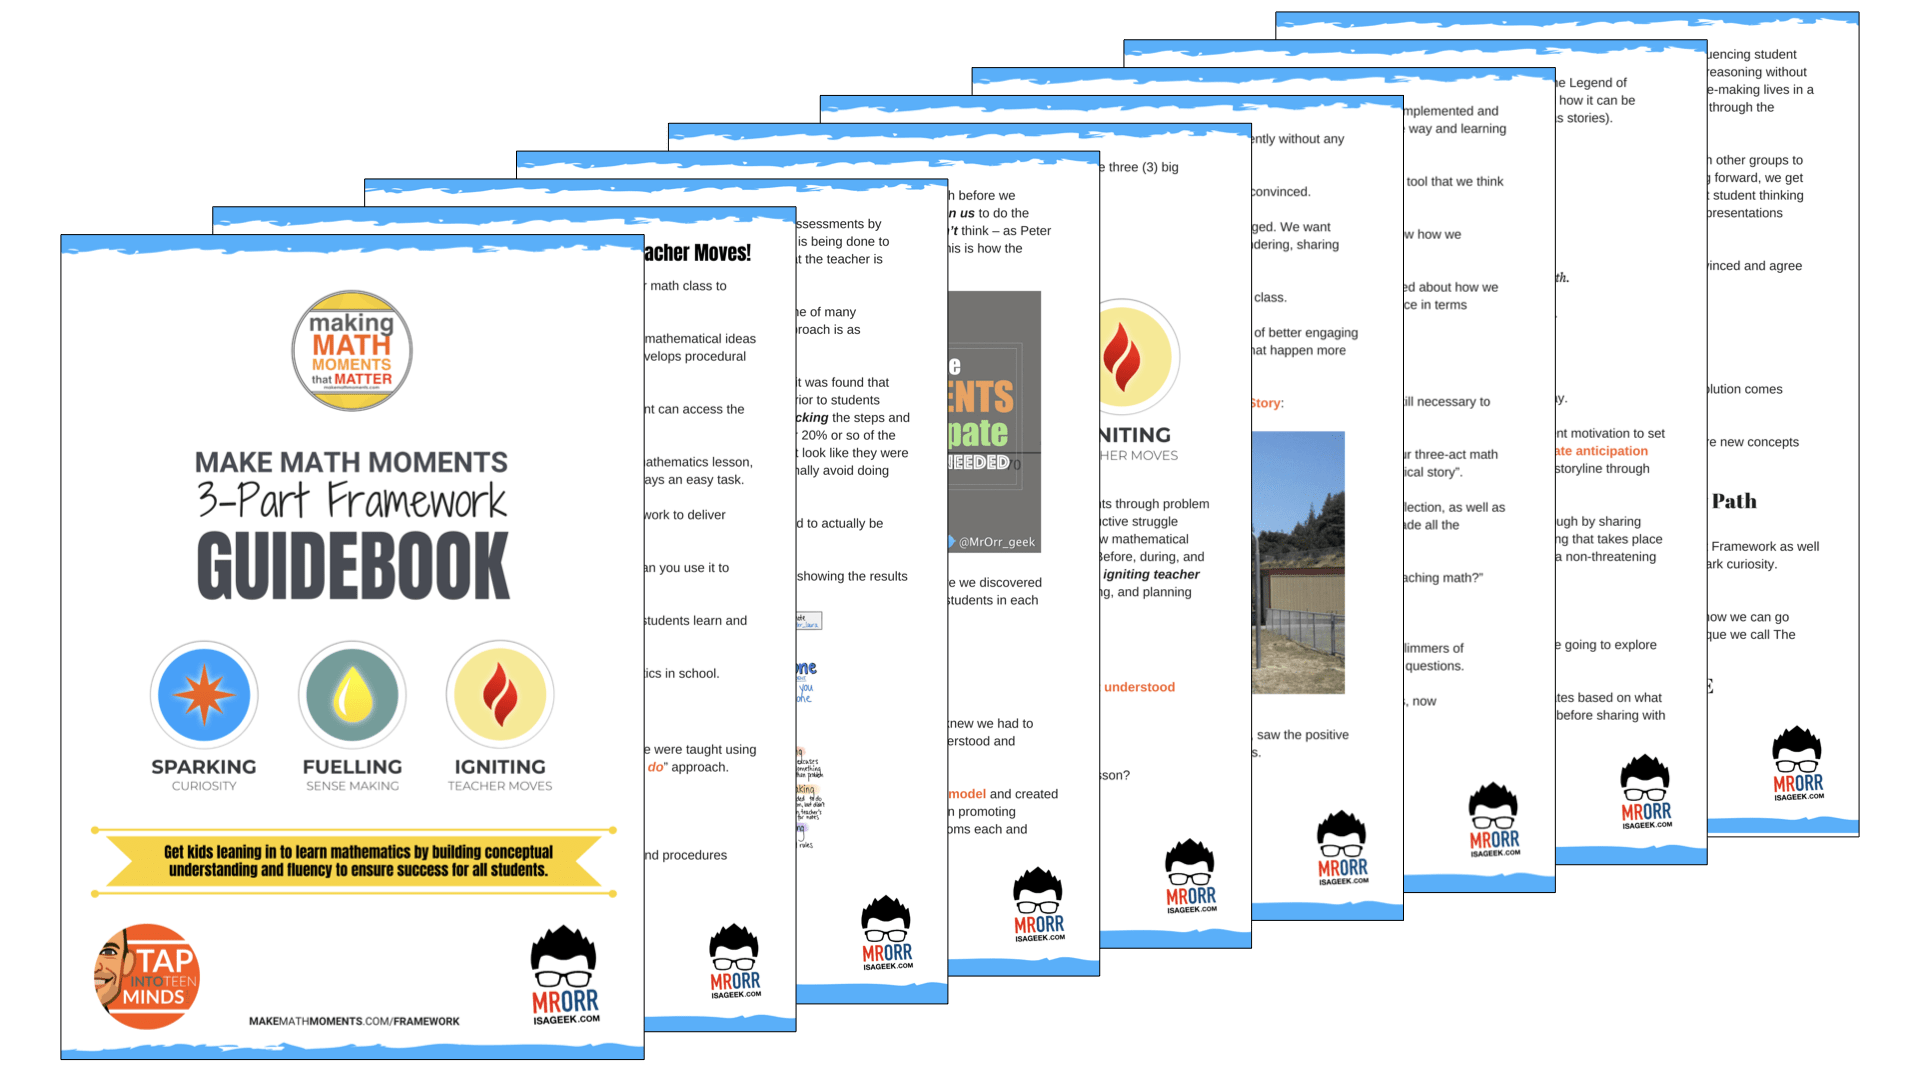
WANT TO LEARN HOW TO TEACH THROUGH TASK?
Share With Your Learning Community:

About Kyle Pearce
I’m Kyle Pearce and I am a former high school math teacher. I’m now the K-12 Mathematics Consultant with the Greater Essex County District School Board, where I uncover creative ways to spark curiosity and fuel sense making in mathematics. Read more.
Read More From The Blog

