Using Desmos to Create Interactive Math Investigations
Just recently, I have really been extending the effectiveness of inquiry/discovery based learning in my classroom by having students work at the whiteboards around my room. Students in grade 9 applied math are usually disengaged in math class because they have likely struggled with mathematics in elementary school. While I’m thoroughly enjoying the learning environment and collaborative culture that is developing in my classroom, I also want to ensure I give students access to some great explorations that may not be so easy on a blank whiteboard.
After recently checking out Michael Fenton’s “Match My Line” activity and seeing an innovative way to break an investigation down into a series of Desmos graphs by Jon Orr, I thought I’d try to do something similar with linear relations:
Scaffold Students Along, Linking From Graph-to-Graph
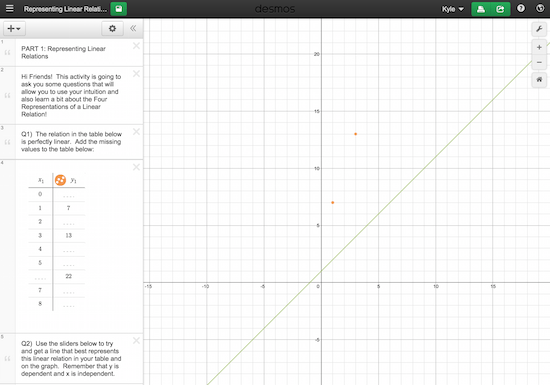
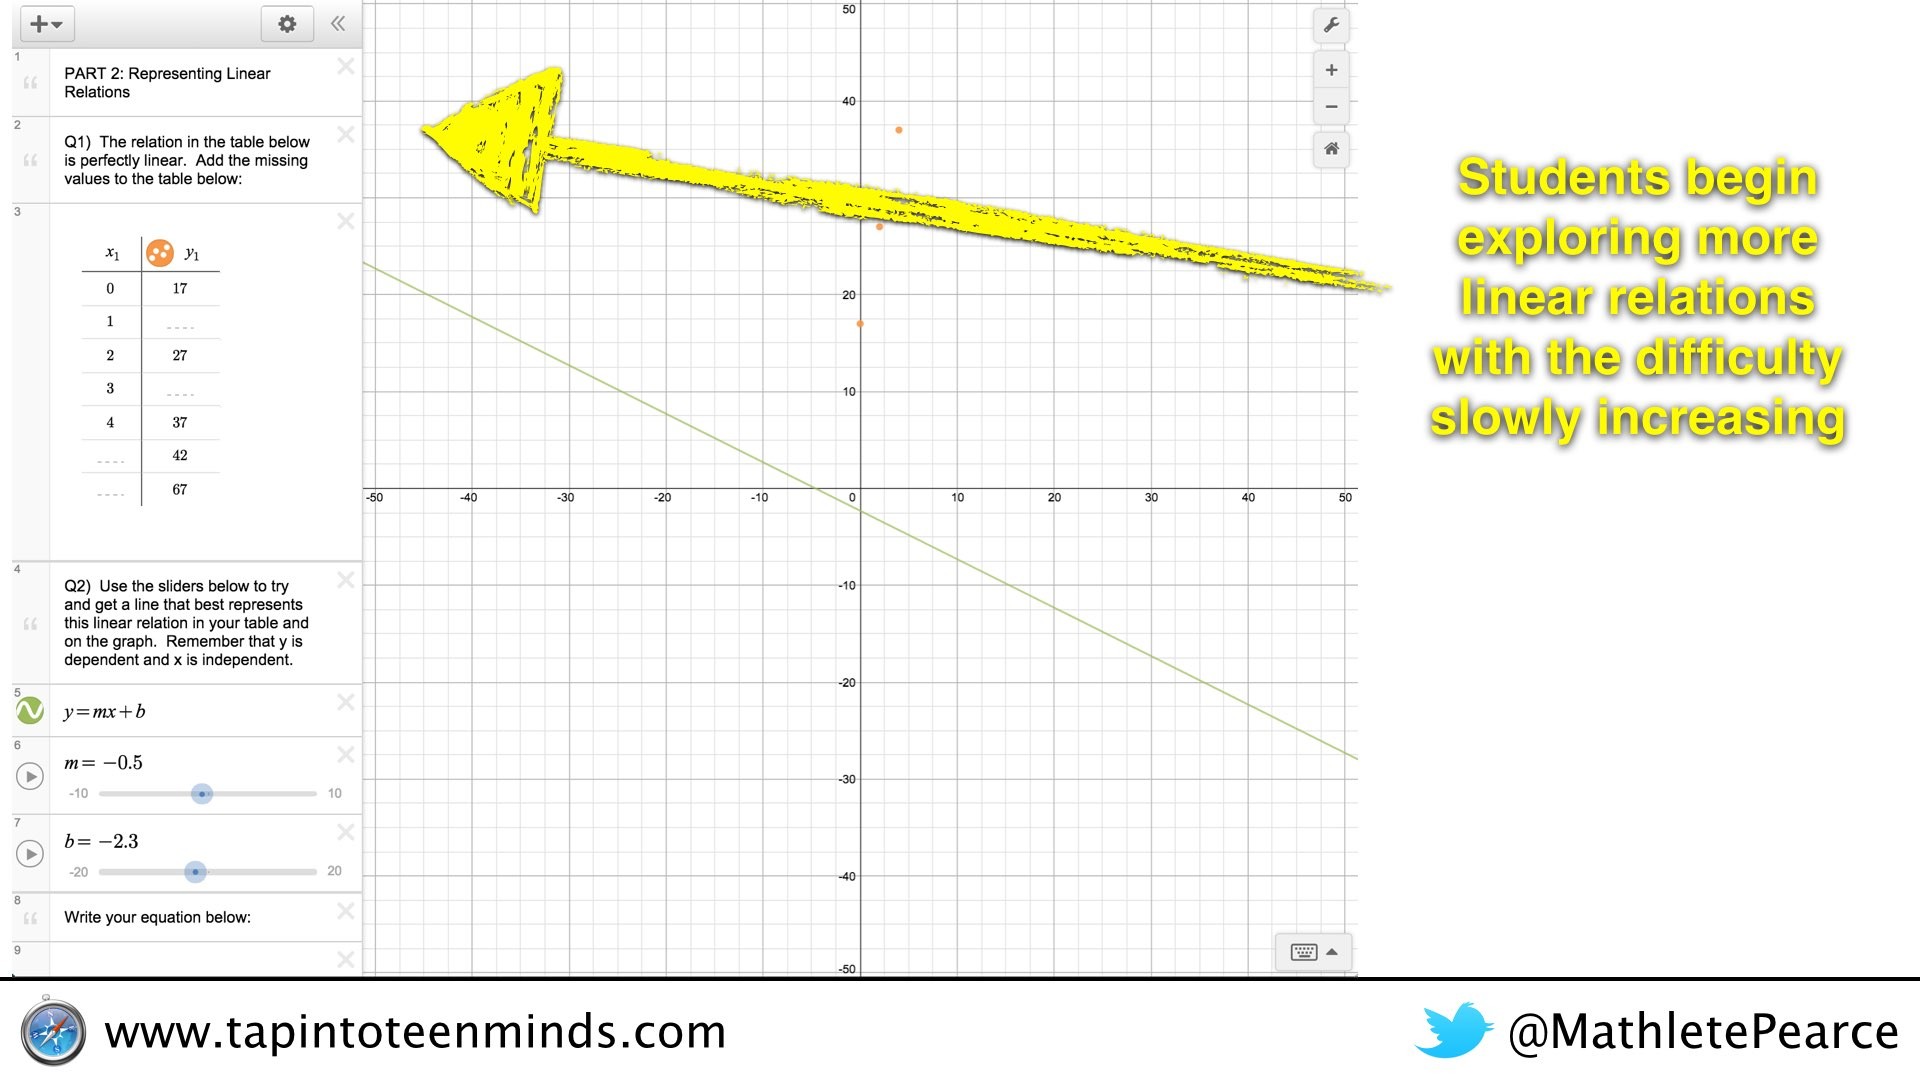
In the activity, students begin using their understanding of linear relations and constant growth to determine missing values in a table:
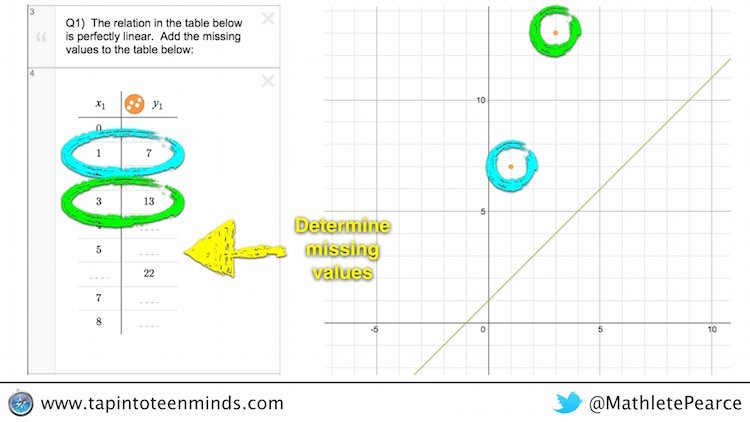
After students have found the missing values in the table and plotted those points, they can now begin using the sliders for ‘m’ (slope/rate of change) and ‘b’ (initial value). It is important to note here that I will not discuss what these values are – that’s why we’re doing the investigation. Hopefully, as a group, we can consolidate later and settle on what these values might be called based on their characteristics.

Students can then write their equation. While this is a bit redundant, I want to expose my students to as many tools throughout the investigation as possible as this is the first time we are using Desmos this semester. They are also asked to write an explanation/reflection to see if they can recognize what ‘m’ and ‘b’ really do and where we can find them in the table.
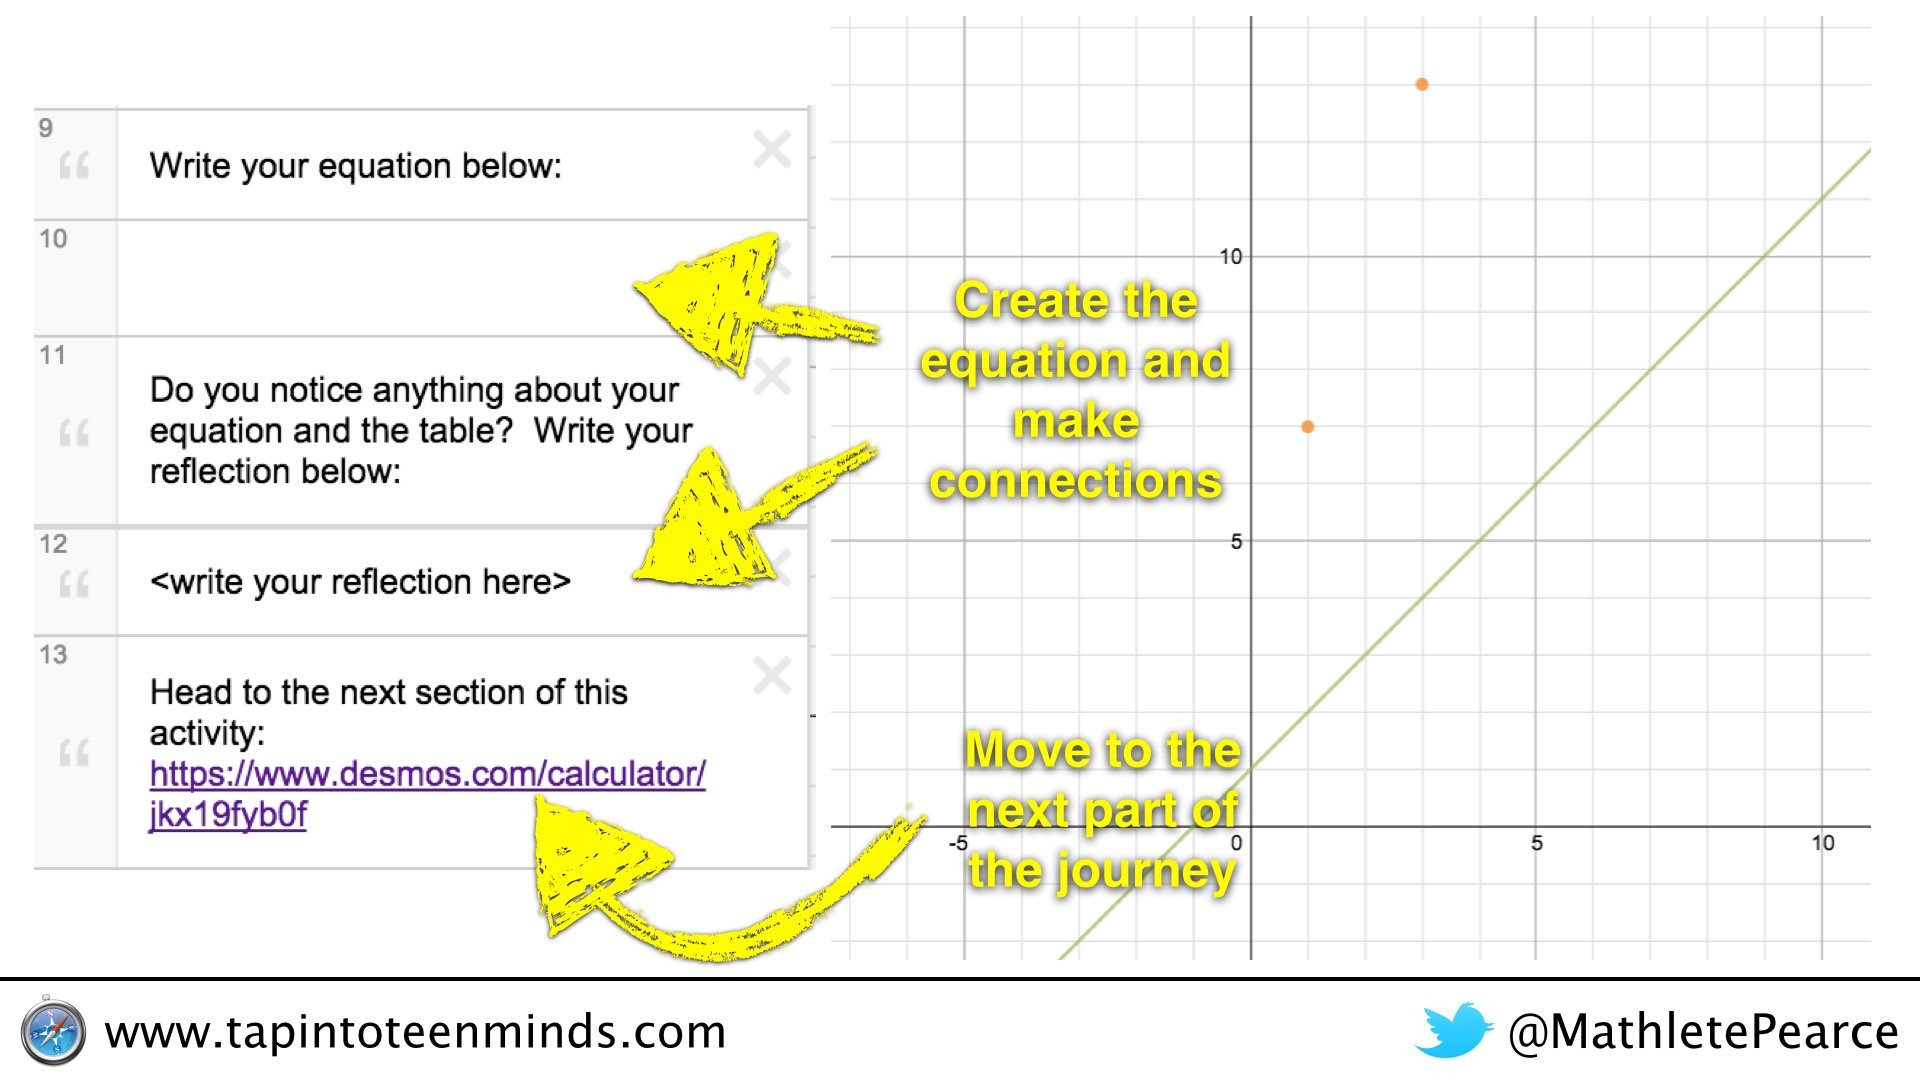
After they have completed the first part, they click on the link and move on to the next portion of the Desmos Math Journey:
Start Your Desmos Math Journey Here
Click on the graph below to start this Desmos Math Journey:
Here are some direct links to each of the six parts:
Have any Desmos Math Journeys to Share?
Toss the links in the comments!
WANT TO LEARN HOW TO TEACH THROUGH TASK?

Share With Your Learning Community:

About Kyle Pearce
I’m Kyle Pearce and I am a former high school math teacher. I’m now the K-12 Mathematics Consultant with the Greater Essex County District School Board, where I uncover creative ways to spark curiosity and fuel sense making in mathematics. Read more.
Read More From The Blog
I really like this. These uses of Desmos really show how we can make linear relations dynamic. The only thing I would suggest is to make this more in line with grade 9 applied math is to move from the equation y = mx + b to something that looks like it is more in context (which is what the grade 9 curriculum is supposed to be grounded in). And you can do that in Desmos by just changing the variables to, say C=mn + b, so that it looks like it is more in a context like this https://www.desmos.com/calculator/gaagwvp0pn
Just a thought
Hi David – great point. I should probably put a few of those together especially since I preach about context so much.
One thing I have been intentionally doing this semester is trying to give my 1P students more algebraic content to work with. Surprisingly, I’ve had some decent success with developing the question so that they dive in by using words like “challenge” or “magic number” or “puzzle”. Seems silly, but I keep on playing with the delivery style and they are buying in.
Thanks for your continued feedback. Always appreciative of the learning opportunity.
Can you use these types of math journeys on the Desmos app for iPads?
Unfortunately, I believe the app does not let you follow the links. However, it should be noted that you can run Desmos straight from the browser on an iPad. That is how we use it in my class – on an iPad and in safari.
Benefits include the ability for students to login to save their work and access things like this learning journey at a later date. The app does not allow for this.
Good luck!