Unit of Study:
Unit 7 - Algebraic Models - Making ConnectionsMFM1P Specific Expectations
The math help provided for MFM1P Grade 9 Applied will address the following specific expectations:LR2.02 - – construct tables of values, scatter plots, and lines or curves of best fit as appropriate, using a variety of tools (e.g., spreadsheets, graphing software, graphing calculators, paper and pencil), for linearly related and non-linearly related data collected from a variety of sources (e.g., experiments, electronic secondary sources, patterning with concrete materials) (Sample problem: Collect data, using concrete materials or dynamic geometry software, and construct a table of values, a scatter plot, and a line or curve of best fit to represent the following relationships: the volume and the height for a square-based prism with a fixed base; the volume and the side length of the base for a square-based prism with a fixed height.);
MFM1P Overall Expectations
The math help provided for MFM1P Grade 9 Applied will address the following overall expectations:Linear Relations - LR2 - Determine the characteristics of linear relations.
MFM1P Math Task Template
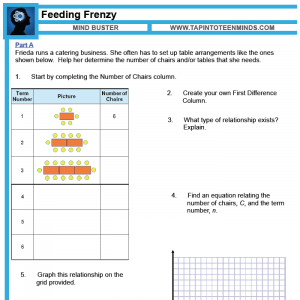
Check out this Math Task Template to get some practice in 7.3 – More Linear and Non-Linear Patterning of the grade 9 applied math course.Share With Your Learning Community:

About Kyle Pearce
I’m Kyle Pearce and I am a former high school math teacher. I’m now the K-12 Mathematics Consultant with the Greater Essex County District School Board, where I uncover creative ways to spark curiosity and fuel sense making in mathematics. Read more.
Access Other MFM1P Grade 9 Applied Resources
Not What You're Looking For?
Search MFM1P Grade 9 Applied Resources By Criteria:
Unit 0 - IntroductionUnit 1 - Measurement 2D and 3DUnit 2 - Measurement and OptimizationUnit 3 - Exploring Relationships - Lines and Curves of Best FitUnit 4 - Proportional ReasoningUnit 5 - Linear RelationsUnit 6 - Multiple Representations of Linear RelationshipsUnit 7 - Algebraic Models - Making ConnectionsUnit 8 - Geometric Relationships
Angle Relationships
Angles of Parallel Lines With Transversal
Area
Creating Equations
Data Management
Direct and Partial Variation
Distance-Time Graphs
Distributive Property
Exterior Angles of a Triangle
Extrapolation
First Differences
Geometric Relationships
Graphical Stories
Graphing Linear Relations
Graphing With Rise Over Run
Initial Value
Interior Angles of a Triangle
Interpolation
Interpreting Graphs
Interpreting Linear Equations
Investigations
Linear Equations
Linear Relations
Linear Relationships
Lines of Best Fit
Maximizing Area
Measurement
Minimizing Perimeter
Modelling With Equations
Non-Linear Relations
Optimization
Patterning
Percentages
Perimeter
Point of Intersection
Powers and Exponents
Predictions
Problem Solving
Proportional Reasoning
Pythagorean Theorem
Rate of Change
Ratios and Rates
Relationships
Representations of a Linear Relation
Representations of Linear Relationships
Rise Over Run
Scatter Plots
Simplifying Like Terms
Simplifying Polynomials
Slope of a Line
Solving Equations
Solving Linear Systems
Solving Proportions
Substitute Into Equations
Triangles
Unit Rates
Volume

