MFM1P Specific Expectations
The math help provided for MFM1P Grade 9 Applied will address the following specific expectations:LR1.03 - Carry out an investigation or experiment involving relationships between two variables, including the collection and organization of data, using appropriate methods, equipment, and/or technology (e.g., surveying; using measuring tools, scientific probes, the Internet) and techniques (e.g.,making tables, drawing graphs).
MFM1P Overall Expectations
The math help provided for MFM1P Grade 9 Applied will address the following overall expectations:LR1 - Apply data-management techniques to investigate relationships between two variables.
MFM1P Math Task Template
Check out this Math Task Template to get some practice in 3.1 – Introduction to Relationships of the grade 9 applied math course.MFM1P Math Videos Related To This Topic
Check out these Math Videos to learn more about 3.1 – Introduction to Relationships of the grade 9 applied math course.MFM1P Khan Academy Practice
Check out this Khan Academy Practice link to learn more about 3.1 – Introduction to Relationships of the grade 9 applied math course.MFM1P – Foundations of Mathematics – Grade 9 Math Applied
Learning Targets:
- Interpret the meanings of points on scatter plots or graphs that represent linear relations, including scatter plots or graphs in more than one quadrant.
- Carry out an investigation or experiment involving relationships between two variables, including the collection and organization of data, using appropriate methods, equipment, and/or technology.
Minds On
Scatter Plot Diagnostic Assessment
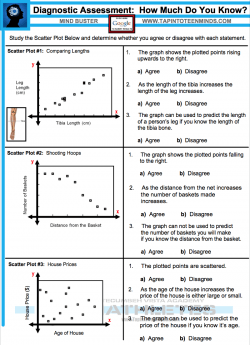
Students will analyse the scatter three scatter plots given on the page comparing:
- Scatter Plot #1:
Leg Length vs. Tibia Length - Scatter Plot #2:
Number of Baskets vs. Distance from the Basket - Scatter Plot #3:
House Price vs. Age of House
Students will then state whether they agree or disagree with the three statements next to each scatter plot.
Submit Your Results in the Google Form
Once complete, students will submit their answers via a Google Docs Form.
Think, Pair, Share
Answer the Statements & Compare
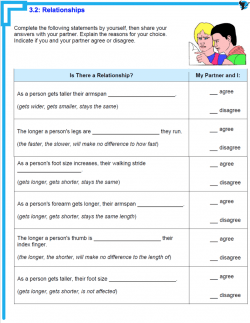
Students will complete the following relationship statements individually, then they will share their answers with a partner.
On the sheet, indicate whether you and your partner agree or disagree. If you disagree with your partner, have a conversation to determine which view makes the most sense and make the appropriate changes on your worksheet.
Action
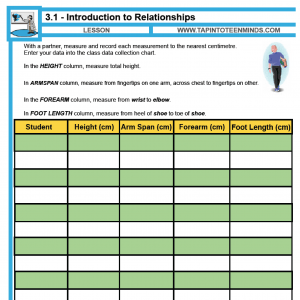
Measure and Record Height, Forearm, Arm Span, & Foot Length
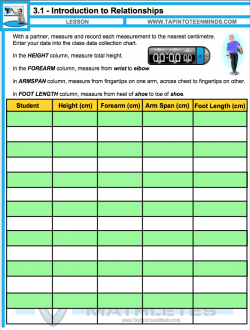
With a partner, measure and record each measurement to the nearest centimetre. Enter your data into the class data collection chart.
- In the HEIGHT column, measure total height.
- In the FOREARM column, measure from wrist to elbow.
- In ARMSPAN column, measure from fingertips on one arm, across chest to fingertips on other.
- In FOOT LENGTH column, measure from heel of shoe to toe of shoe.
Consolidate
Creating a Scatter Plot
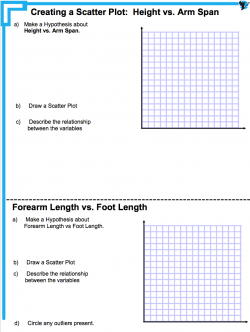
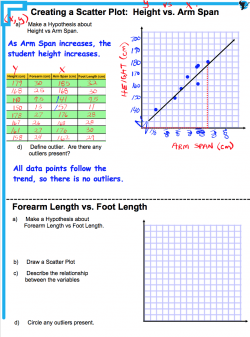
Individually, students will now consolidate their learning by creating two scatter plots:
- Scatter Plot #1 – Height vs. Arm Span
(Teacher-Led) - Scatter Plot #2 – Forearm Length vs. Foot Length
(Individual)
YouTube Video
MFM1P – 3.1 – Relationships & Scatter Plots
Watch Mr. Pearce in this YouTube Video as he quickly re-caps the Height vs. Arm Span scatter plot we created during class. *Note that I forgot to make a Hypothesis as required in part a)*
Worksheets & Resources
MFM1P – 3.1 – Relationships & Scatter Plots
 |
 |
Have you made revisions to improve this lesson?
Please comment below or contact me to share!
Share With Your Learning Community:

About Kyle Pearce
I’m Kyle Pearce and I am a former high school math teacher. I’m now the K-12 Mathematics Consultant with the Greater Essex County District School Board, where I uncover creative ways to spark curiosity and fuel sense making in mathematics. Read more.
Access Other MFM1P Grade 9 Applied Resources
Not What You're Looking For?
Search MFM1P Grade 9 Applied Resources By Criteria:
Angles of Parallel Lines With Transversal
Area
Creating Equations
Data Management
Direct and Partial Variation
Distance-Time Graphs
Distributive Property
Exterior Angles of a Triangle
Extrapolation
First Differences
Geometric Relationships
Graphical Stories
Graphing Linear Relations
Graphing With Rise Over Run
Initial Value
Interior Angles of a Triangle
Interpolation
Interpreting Graphs
Interpreting Linear Equations
Investigations
Linear Equations
Linear Relations
Linear Relationships
Lines of Best Fit
Maximizing Area
Measurement
Minimizing Perimeter
Modelling With Equations
Non-Linear Relations
Optimization
Patterning
Percentages
Perimeter
Point of Intersection
Powers and Exponents
Predictions
Problem Solving
Proportional Reasoning
Pythagorean Theorem
Rate of Change
Ratios and Rates
Relationships
Representations of a Linear Relation
Representations of Linear Relationships
Rise Over Run
Scatter Plots
Simplifying Like Terms
Simplifying Polynomials
Slope of a Line
Solving Equations
Solving Linear Systems
Solving Proportions
Substitute Into Equations
Triangles
Unit Rates
Volume

