MPM1D – Principles of Mathematics – Grade 9 Academic
Sec. 4.1 – Direct Variation
Investigation: Going for a Jog
Video discussing the mind buster problem from our section on Direct Variation:
Identify the independent/dependent variables.
Describe the shape of the graph.
Where does it intersect the vertical axis?
Write an equation to find the distance, d, in metres, that Susan jogs in t mins.
Use the equation to determine the distance that Susan can jog in 25 mins.
Consider the distance Susan jogged in 5 minutes.
What happens to this distance when the time is doubled?
What happens to the distance when the time is tripled?
What Is Direct Variation?
A Direct Variation is a relationship between two variables in which one variable is a constant multiple of the other variable.
A video discussing the following related to Direct Variation:
- How we can relate direct variation to proportional reasoning,
- what a direct variation looks like in a table and graph, and
- how to find the constant of variation, m.
From Homework – Page 242-244 #6
In the following video, Mr. Pearce and the class discuss a question from the homework. This was recorded the next day at the beginning of class with the help of the students. The question asks:
The cost of oranges varies directly with the total mass bought. 2 kg of oranges costs $4.50.
a) Describe the relationship in words.
b) Write an equation relating the cost and the mass of the oranges. What does the constant of variation represent?
c) What is the cost of 30 kg of oranges?
Sec. 4.2 – Partial Variation
What Is Partial Variation?
A Partial Variation is a relationship between two variables in which the dependent variable is the sum of a constant number and a constant multiple of the independent variable.
A video discussing the following related to Partial Variation:
- What a partial variation looks like in a table,
- what a partial variation looks like in a graph,
- what a partial variation looks like in an equation, y = mx + b and
- how to find the constant of variation, m.
Sec. 4.2.R – Direct and Partial Variation
This video was recorded at the beginning of class. Mr. Pearce and the class take up a question from the previous day to summarize Partial Variation and discuss why the relationships involved in the question are Partial and not Direct variation. The question is:
A theatre company produced the musical Cats. The company had to pay a royalty fee of $1250 plus $325 per performance. The same theatre company also presented the musical production of Fame in the same year. For the production of Fame, they had to pay a royalty fee of $1400 plus $250 per performance.
- Write an equation that relates the total royalties and the number of performances for each musical.
- Graph the two relations on the same grid.
- When does the company pay the same royalty fee for the two productions? (Break Even Point)
- Why do you think the creators of these musicals would set royalties in the form of a partial variation instead of a direct variation?
Sec. 4.3 – How to Find Slope of a Line Using Rise Over Run
This video was recorded during a lesson. Students were asked to work with their table groups to answer the following:
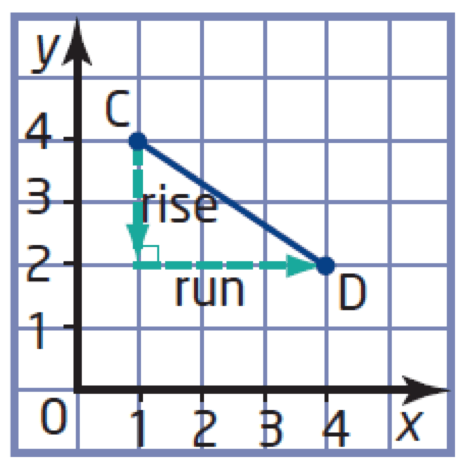
Consider the graph of line segment AB to the right.
- Is the slope positive or negative? Explain.
- Determine the rise and run by counting grid units.
- Determine the slope of the line segment AB.
Sec. 4.3 – How to Find Slope of a Line Using Rise Over Run
This video shows students how to find the slope of a slide as well as the slope of a roof.
Sec. 4.3 – Draw a Line Given Slope and One Point
This video recaps the Mind Buster portion of our Sec. 4.3 (5.3) Slope (Part 2) lesson where:
A line segment has one endpoint, A(4, 5) and a slope of -2/3.
Can you find the coordinates of 2 other points on the line?
Sec. 4.4 – Slope as a Rate of Change – Interpreting Slope of a Line
This video focuses on Slope as a Rate of Change for a linear system of equations. In this case, the question is as follows:
The distance-time graph shows two cars that are travelling at the same time.
- Which car has the greater speed, and by how much?
- What does the point of intersection of the two lines represent?
Sec. 4.5 – Identifying Linear & Non-Linear Relationships with First Differences
This video demonstrates How First Differences in a Table of Values Can Identify Linearity of a Relationship by comparing two relationships from a table of values. The question from the video asks:
Each table shows the speed of a skydiver before the parachute opens. Without graphing, determine whether the relation is linear or non-linear.
- Case when there is no air resistance, and
- Case when there is air resistance.
Sec. 4.7 – Connecting Variation, Slope and First Differences of Linear Relations
Today, students had a discussion about the four representations of a linear relationship; a description, table, graph and equation. From this, students took a table to determine the type of variation, the slope/rate of change/constant of variation, initial value and a description to match. They then created an equation in y = mx + b form to summarize their understanding.
Take the following table of values and create the following representations to match:
- A Description,
- A Graph, and
- An Equation.